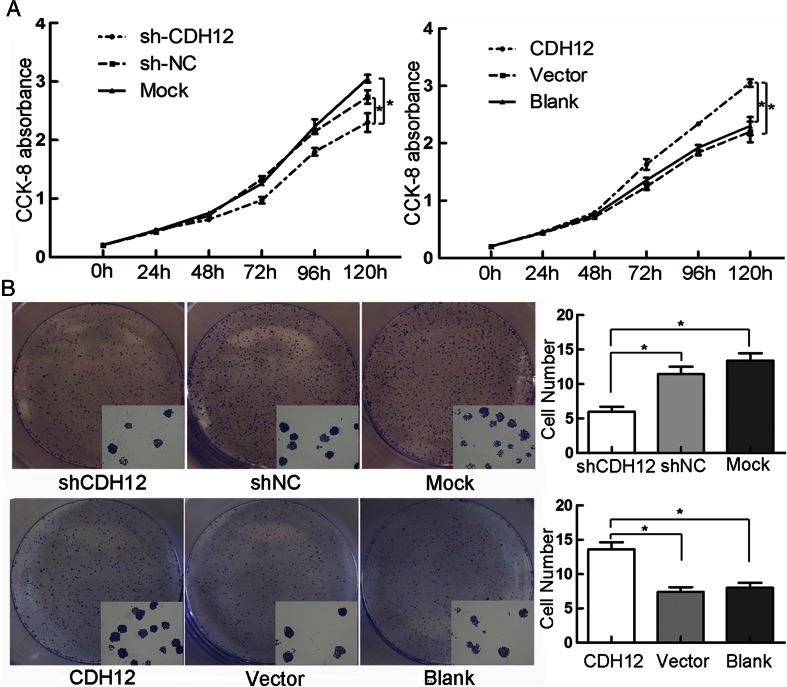
Fig. 3.
a Proliferation curve for SW620 cells with low CDH12 expression whose proliferation ability was inhibited compared with controls (left panel) and HCT116 cells with high-expression CDH12 whose proliferation ability was promoted (right panel). b Clone formation quantities were less or more in CDH12 low-expression group (SW620, upper panel) or in high-expression group (HCT116, lower panel) compared with controls. *P < 0.05

