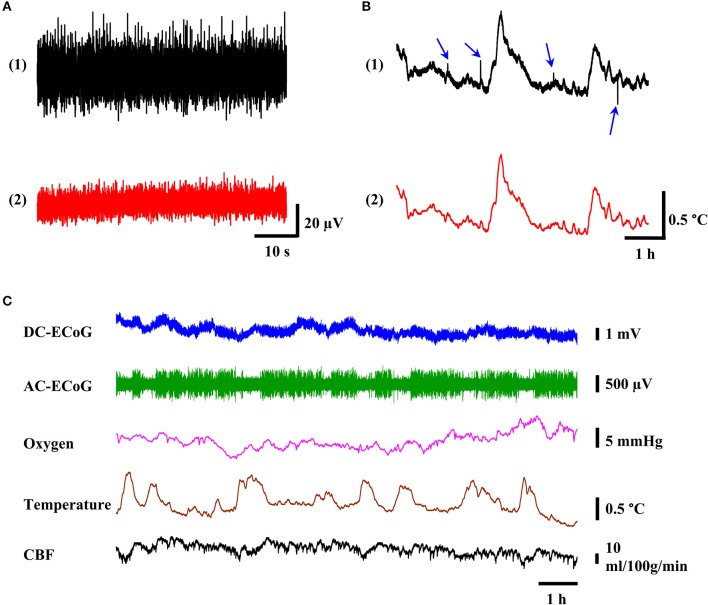
Figure 5.
The quality of recorded multimodality brain signal. (A) The noise level of ECoG signal before and after physical isolation of cables. (B) Representative tracing of 6-h temperature recording (black trace) with noise spikes (blue arrows) and after lowpass filtering with 0.5 Hz cutoff frequency (red trace). (C) Example of 12-h reliable multimodality recording of ECoG, oxygen tension, temperature, and CBF signals without significant signal drift and noise spikes.

