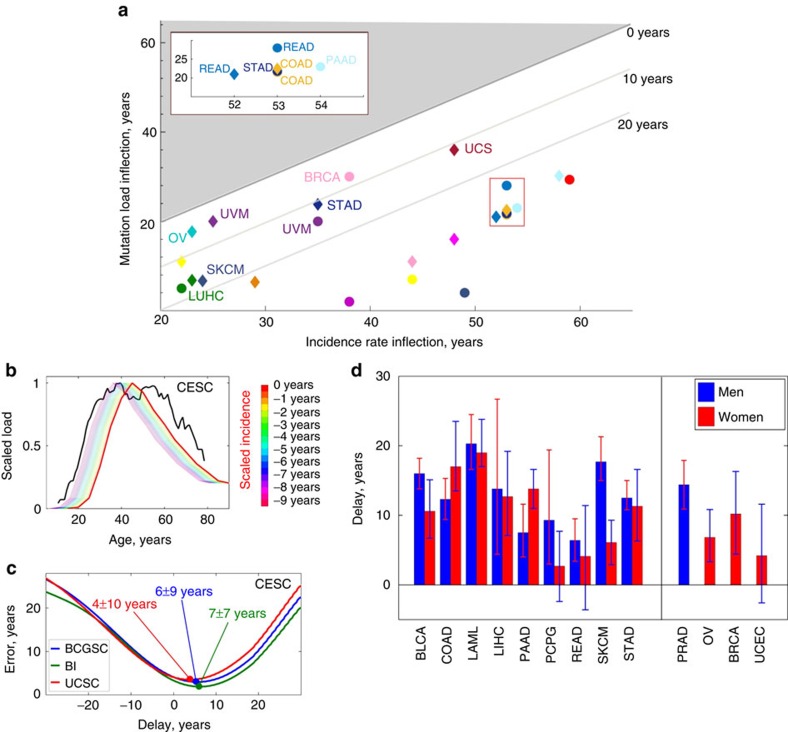
Figure 4. Lags between cancer incidence and mutation accumulation.
(a) Inflection points in cancer incidence versus inflection points in somatic mutation accumulation. Bounds corresponding to 0, 10 and 20 year delays in cancer incidence versus mutation accumulation are shown, and the select cancers are labelled. The red rectangle is amplified in the inset. The area coloured in grey corresponds to the situation when mutation load inflection occurs later than incidence inflection; no cancers were found to belong to this region. (b) Identifying the delay between reported cancer incidence and somatic mutation accumulation for cervical cell carcinoma and endocervical adenocarcinoma (CESC). Samples sequenced by BCGSC, IlluminaGA pipeline. The cancer incidence (red) and somatic mutation accumulation (black) curves are renormalized to the same scale, then the incidence curve is displaced until the Euclidean distance functional between the two curves reaches its minimum. (c) Behaviour of time delay estimation error for data sets produced by BCGSC (blue), BI (green) and UCSC (red), cervical cell carcinoma and endocervical adenocarcinoma (CESC). The estimated time delay between cancer incidence and somatic mutation accumulation patterns corresponds to the minimum of the error (denoted by blobs). (d) Estimated time delays between cancer incidence and somatic mutation accumulation patterns for non-gender-specific (left) and gender-specific (right) cancers. For every cancer type, averaging over estimates based on the results by different datacenters/pipelines was performed. Red bars correspond to women, and blue to men. Errors are s.d., calculated using bootstrapping as described in Methods.

