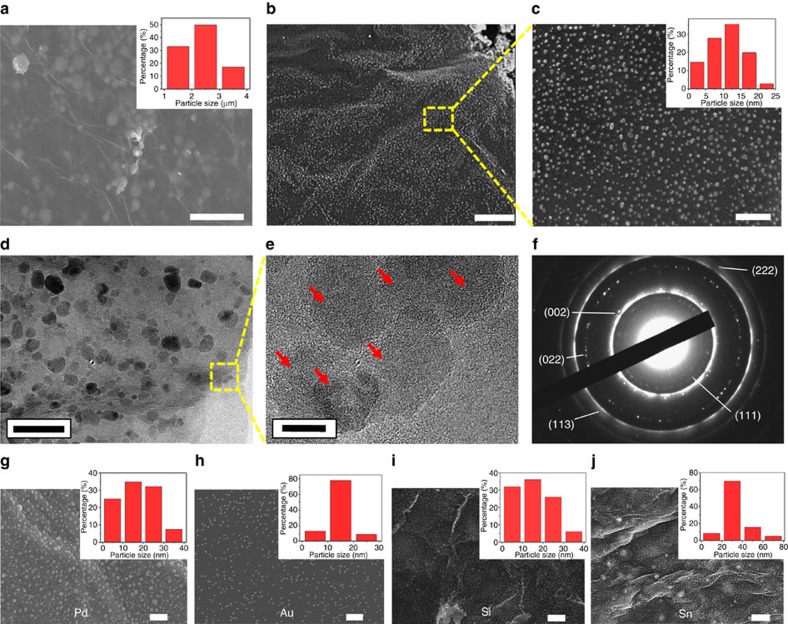
Figure 3. Characterization of nanoparticles formed in RGO network.
(a) SEM image of RGO films with embedded Al microsized particles. (b,c) SEM images of Al nanoparticles after 2,200 K Joule heating for 1 min. (d–f) TEM images of nAl-RGO with different magnifications and the corresponding selected area diffraction pattern patterns. (g–j) SEM images of nanoparticles formed in RGO network with Pd, Au, Si and Sn. Particle size distribution are also shown in the insets. Scale bar, (a) 10 μm, (b) 1 μm, (c) 200 nm, (d) 100 nm, (e) 10 nm, (g,h) 200 nm, (i) 300 nm and (j) 1 μm.

