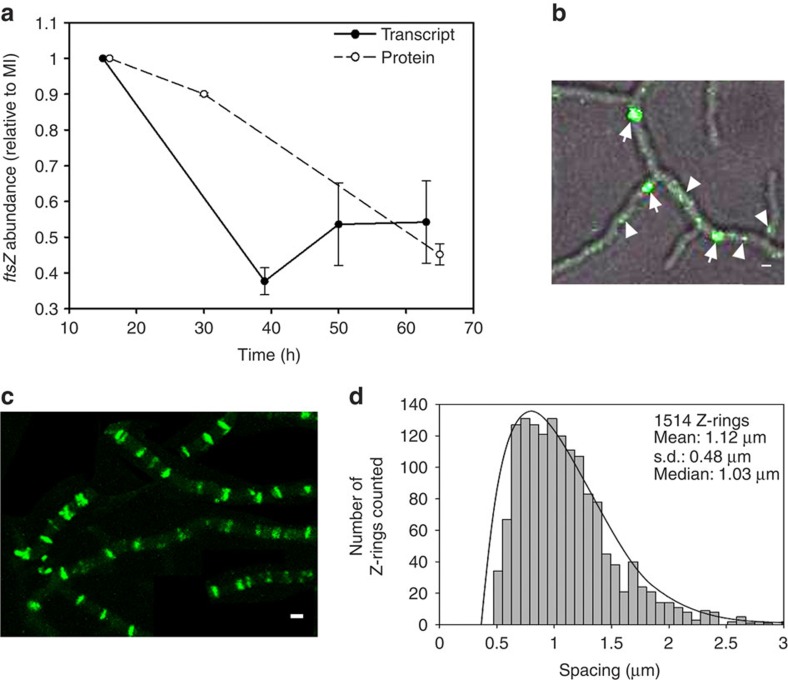
Figure 4. ftsZ gene expression, protein abundance and cellular localization.
(a) qRT–PCR analysis of FtsZ mRNA (solid line) and FtsZ protein abundance (dashed line). The average values of three biological replicates are presented (with SD). The MI sample (15 h in transcriptomics, 16 h in proteomics) was used for normalization and consequently has a value of 1 and an s.d. of 0. All abundance values were significantly different with respect to the 15-h sample (P value<0.05; limma analysis43 for protein; analysis of variance with Turkey's HSD post hoc analysis for transcript). (b) Z-ring formation shown by eGFP-FtsZ at early developmental time points of S. coelicolor grown on GYM agar plates (12 h). Fluorescence and phase-contrast images are overlaid. Arrowheads label transitory dynamic spiral-like structures that do not cross the entire diameter of the hyphae. Arrows label Z-rings. (c) Maximum projection of the time-lapse experiments (15 h); 100% of the hyphae had a regular pattern of Z-rings as indicated by eGFP-FtsZ (see Supplementary Movie 1 and Supplementary Fig. 1). (d) Spacing of the Z-rings. The spacing of a total of 1514 Z-rings was analyzed. Scale bars in b and c correspond to 1 μm.

