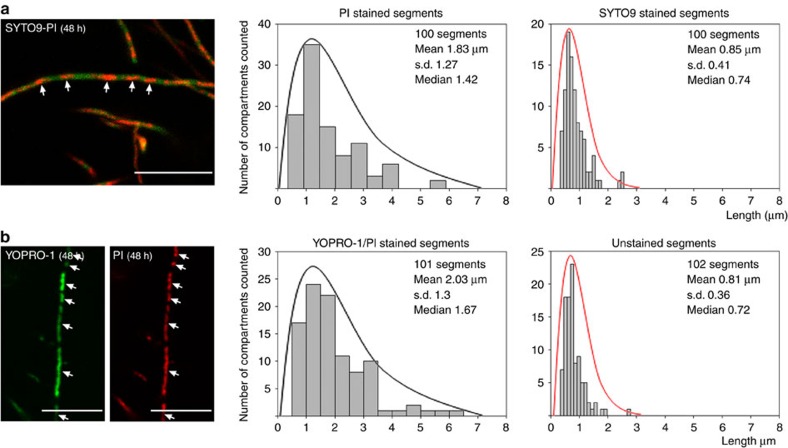
Figure 5. Confocal laser scanning fluorescence microscopy analysis of the ftsZ mutant HU133.
(a) SYTO9 (green) and PI (red) staining (48 h). (b) YOPRO-1 (green) and PI (red) staining (48 h). Histograms of the stained and unstained segments are shown. Two distributions were observed: one from viable segments stained with SYTO9 and not stained with YOPRO-1 or PI (red lines); the second from dying cells stained with YOPRO-1 and/or PI (black lines). The scale bars correspond to 8 μm.

