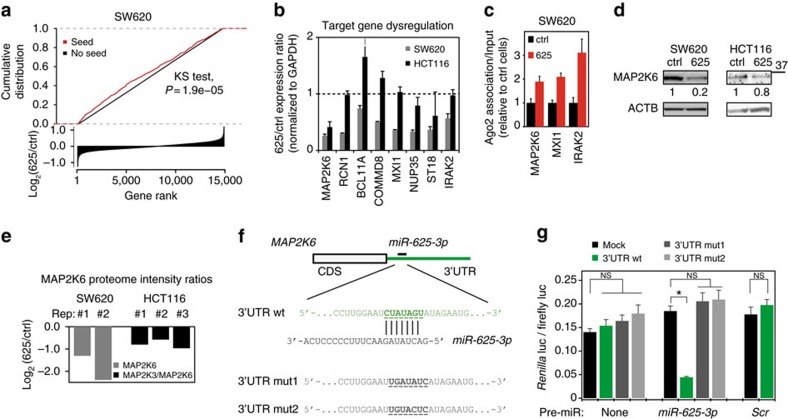
Figure 4. MAP2K6 is a direct and functional target of miR-625-3p.
(a) Genes were ranked according to differential expression after miR-625-3p induction in SW620 cells (log2(625/ctrl) (bottom panel). The cumulative distribution of genes with a miR-625-3p seed sequence (red) was significantly different from the distribution of genes without a seed sequence (black) (P=1.9*10−5, Kolmogorov–Smirnov test; top panel). Note that for clarity, the log2(625/ctrl)-scale is truncated at −1 and 1. (b) The 625/ctrl-expression ratios of eight candidate target genes were determined by qRT–PCR after induction of miR-625-3p (or control) in SW620 cells and HCT116 CRC cells. Shown are mean expression ratio±s.e.m. (n=3). (c) qRT–PCR quantification of candidate target genes in RNA from AGO2-associated precipitates and normalized to GAPDH in input. Mean association±s.e.m. (n=3) displayed relative to control cells. (d) Representative western blots of MAP2K6 in SW620 and HCT116 cells after DOX-induction for 48 h. β-Actin (ACTB) was used as loading control. Quantification of MAP2K6 band intensities (normalized to ACTB) is indicated. (e) Quantification of MAP2K6 downregulation after induction of miR-625-3p as determined by mass-spec proteome analysis of two (SW620) or three (HCT116) independent DOX inductions. Displayed as log2 mean peptide intensity ratio. For SW620 data, 20–45 kDa proteins were excised from a denaturing gel and subjected to unlabelled proteome quantification. For HCT116 data, we used isotope-labelled whole cell lysates described below (see Fig. 6a). Note that while one MAP2K6 specific peptide was quantified in the SW620 lysates, only peptides (n=2) shared between MAP2K3 and MAP2K6 were detected in HCT116 cells. (f) Structure of the 3′UTR of MAP2K6 (ENSG00000108984, miR-625-3p binding site at 3′UTR position 173–180). The close-up depicts miR-625-3p annealed to the wild-type target sequence (underlined) as well as the two mutated sequences used in g. (g) Mean normalized Renilla Luc signal±s.e.m. (n=3) from HEK293T cells 24 h after transfection with psiCHECK-2 reporter containing MAP2K 3′UTR, either of the mutated 3′UTR sequences shown in f or mock. Experiments where a miR-625-3p or control (Scr) pre-miR were co-transfected together with psiCHECK-2 are indicated. *P<0.05 (t-test); NS, not significant.

