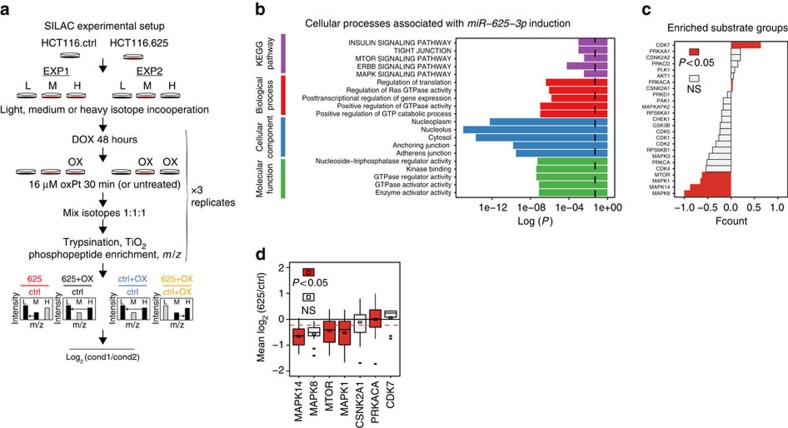
Figure 6. Decreased MAPK signalling is associated with miR-625-3p induction.
(a) Phosphopeptide-enriched SILAC mass-spectrometry analysis was performed on HCT116.ctrl and HCT116.625 cells in two experimental setups done in parallel (‘EXP1' and ‘EXP2') each involving three experimental conditions labelled with light (‘L'), medium (‘M') or heavy (‘H') isotopes. Each experimental condition was done in triplicate. Four data sets were generated by calculating the mean log2 peptide intensity ratios from triplicate experiments for the following conditions: (i) HCT116.625/HCT116.ctrl (red), (ii) oxPt-treated HCT116.625/HCT116.ctrl (black), (iii) oxPt-treated HCT116.ctrl/HCT116.ctrl (blue) and (iv) oxPt-treated HCT116.625/oxPt-treated HCT116.ctrl (yellow). (b) Proteins with significantly dysregulated phosphopeptides after miR-625-3p induction were subjected to GO term and KEGG pathway enrichment analysis. The adjusted P-values for the most associated terms are shown. P=0.05 is indicated with a stippled line. (c) Kinase substrate enrichment analysis (KSEA) on log2(625/ctrl) ratios was calculated for substrate groups as the difference in the number of phosphopeptides with increased phosphorylation minus the number with decreased phosphorylation, and displayed as the fractional delta count (fcount), that is, the delta count divided with the sum of phosphopeptides in each substrate group (coloured bars indicate P≤0.05, hypergeometric test). (d) Mean log2(625/ctrl) phosphorylation levels were calculated for the significant substrate groups in c), and significance of the difference to the population mean (stippled line) calculated with a z-test (P≤0.05 indicated with coloured boxes). Mean and median are shown with a squared box and a horizontal line, respectively, the interquartile range is marked by the lower and upper hinges, respectively, and the whiskers indicate 1.5 times the interquartile range.

