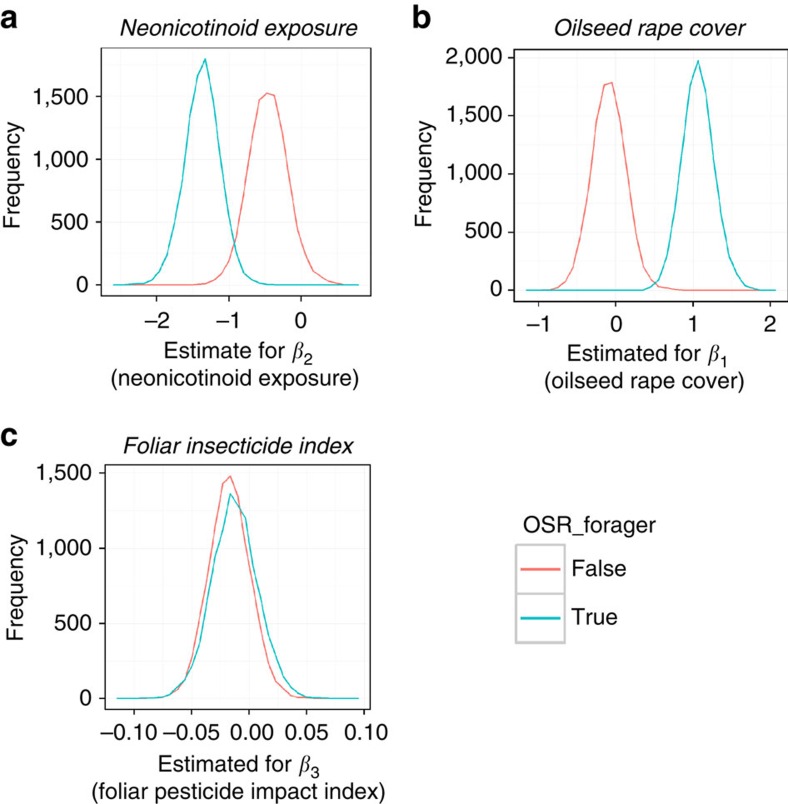
Figure 2. Posterior distributions for the effect sizes describing wild bee population persistence in England.
The posterior distributions show the probability of parameter estimates explaining wild bee population persistence for (a) neonicotinoid dose rate, (b) oilseed rape area and (c) the foliar insecticide index. Posterior distributions for oilseed rape foraging and non-foraging wild bee species are shown in blue and red respectively. Mean probabilities below zero suggest negative effects of these environmental factors. Supplementary Fig. 1 provides the precision for these parameter estimates.

