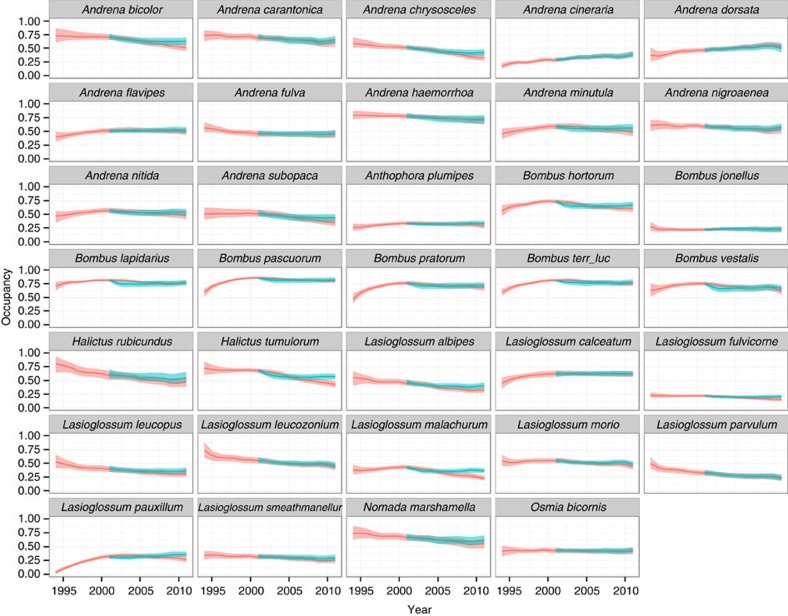
Figure 3. Estimates of the net effect of neonicotinoid exposure on wild bee species that forage on oilseed rape.
Species population persistence trajectories are based on fitted values from individual species models (red line) and are compared with an idealized model in which no neonicotinoids were applied following their first widespread use in 2002 (blue line). Shaded areas show 95% credible intervals.

