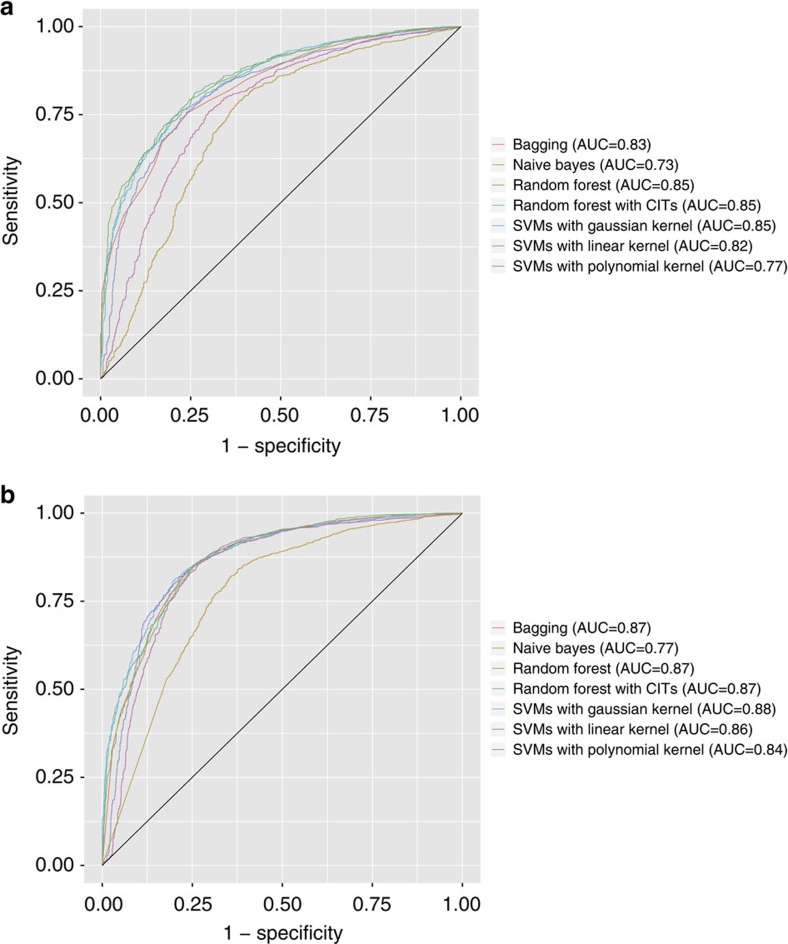
Figure 1. Quantitative image features accurately distinguished malignancies from adjacent dense normal tissues.
(a) ROC curves for classifying lung adenocarcinoma versus adjacent dense normal tissues in the TCGA test set. Classifiers with 80 features attained average AUC of 0.81. (b) ROC curves for classifying lung squamous cell carcinoma from adjacent dense normal tissues in the TCGA test set. Classifiers with 80 features attained average AUC of 0.85. The performance of different classifiers is shown. CIT, conditional inference trees; ROC, receiver operator characteristics.

