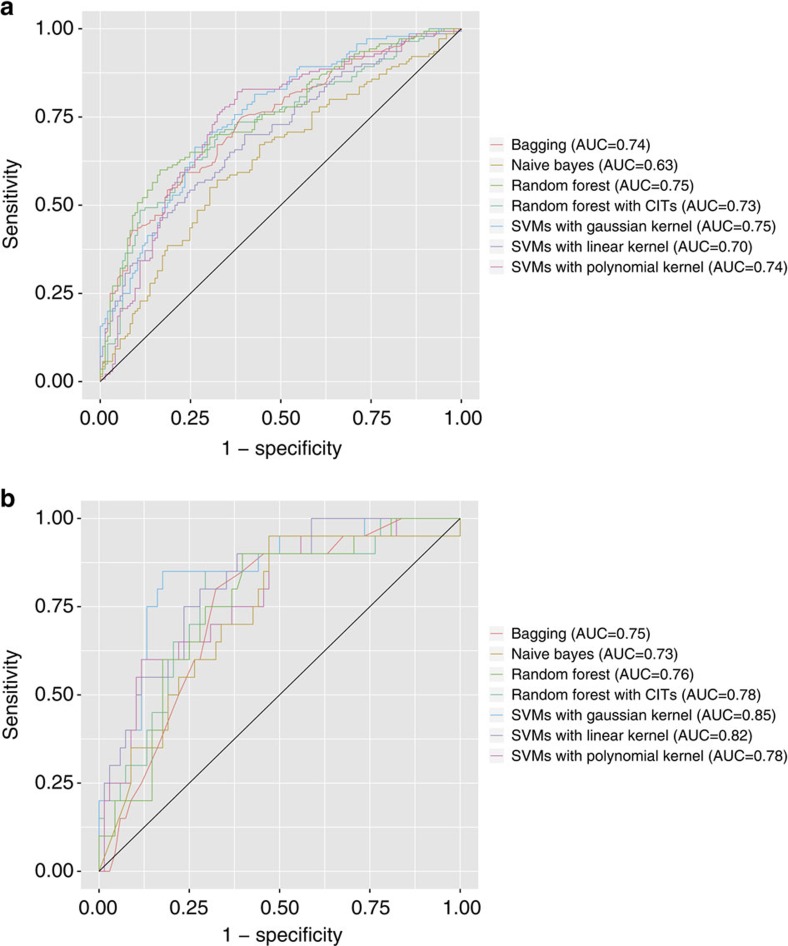
Figure 2. Quantitative image features successfully distinguished histopathology images of lung adenocarcinoma from those of lung squamous cell carcinoma.
(a) ROC curves for classifying the two malignancies in the TCGA test set. Most classifiers achieved AUC>0.7. (b) ROC curves for classifying the two malignancies in the TMA test set. Most classifiers achieved AUC >0.75, indicating that our informatics pipeline was successfully validated in the independent TMA data set. The performance of different classifiers is shown. CIT, conditional inference trees; ROC, receiver operator characteristics.

