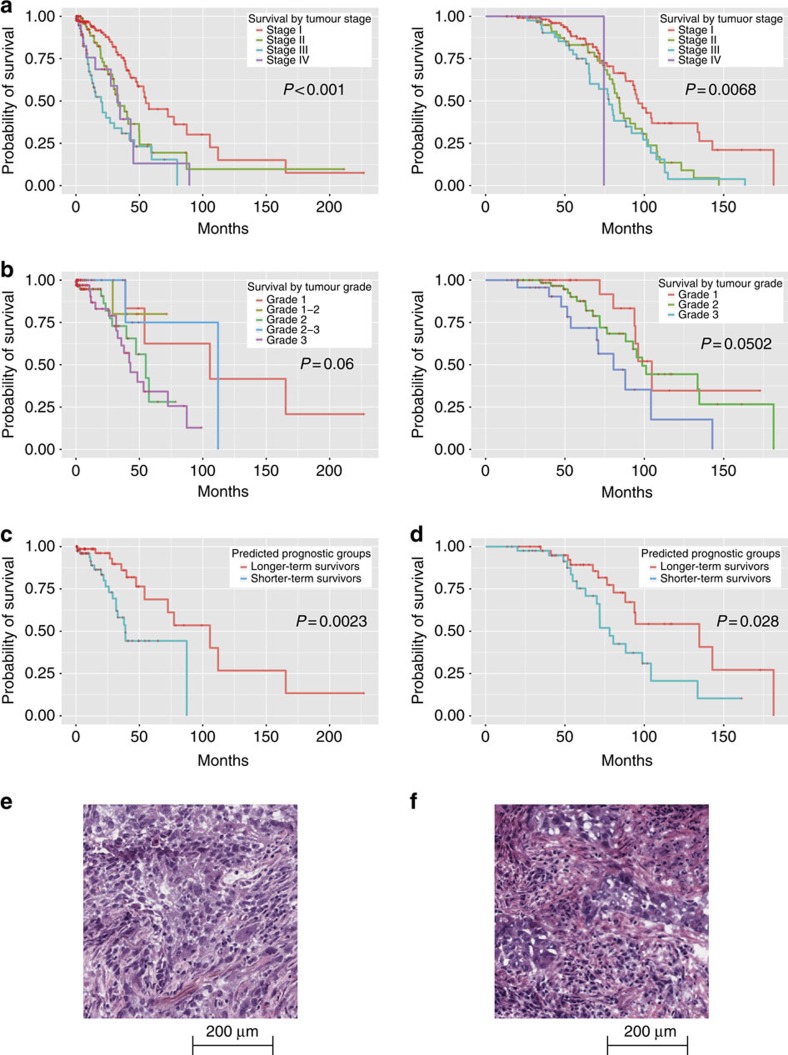
Figure 3. Quantitative image features predicted the survival outcomes of stage I lung adenocarcinoma patients.
(a) Kaplan–Meier curves of lung adenocarcinoma patients stratified by tumour stage. Patients with higher stages tended to have worse prognosis (log-rank test P value <0.001 in TCGA data set, log-rank test P=0.0068 in TMA data set). However, the survival outcomes varied widely. (left: TCGA data set, right: TMA data set). (b) Kaplan–Meier curves of stage I lung adenocarcinoma patients stratified by tumour grade. Tumour grade did not significantly correlate with survival (left: TCGA data set, log-rank test P value=0.06; right: TMA data set, log-rank test P value=0.0502). (c) Kaplan–Meier curves of stage I lung adenocarcinoma patients stratified using quantitative image features. Image features predicted the survival outcomes. Elastic net-Cox proportional hazards model categorized patients into two prognostic groups, with a statistically significant difference in their survival outcomes in the TCGA test set (log-rank test P value=0.0023). (d) The same classification workflow was validated in the TMA data set, with comparable prediction performance. (log-rank test P value=0.028). (e) Sample image of stage I adenocarcinoma with long survival. This patient suffered from stage IB, grade 3 lung adenocarcinoma, and survived more than 99 months after diagnosis. Our classifier correctly predicted the patient as a long survivor. (f) Sample image of stage I adenocarcinoma with short survival. This patient suffered from stage IB, grade 3 lung adenocarcinoma, and survived less than 12 months after diagnosis. Our classifier correctly predicted the patient as a short survivor.

