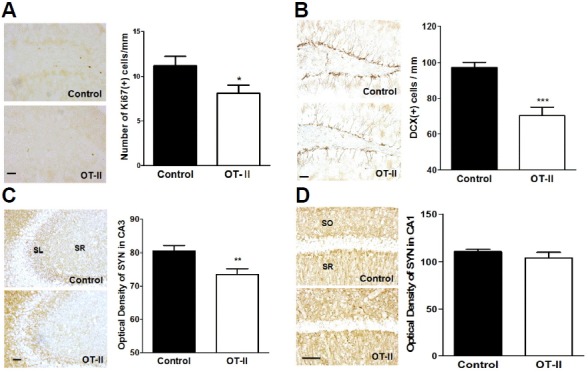
Fig. 2.

OT-II mice showed decreased neurogenesis and synaptic density in hippocampus. (A) Representative images of Ki67 staining of the DG. (B) DCX-positive cells were significantly less abundant in OT-II mice than in control mice. (C) Immunoreactivity of synaptophysin in the CA3 subfields (SL: stratum lucidum; SR: stratum radiatum) of the hippocampus was markedly less abundant in OT-II mice than in the control mice. (D) Immunoreactivity of synaptophysin in the CA1 subfields (SR: stratum radiatum; SO: stratum oriens) of the hippocampus. There was no difference between OT-II mice and control mice. Values are expressed as the mean ± SEM *p < 0.05, **p < 0.01, and ***p < 0.001 as compared to the control mice. Scale bar = 50 μm.
