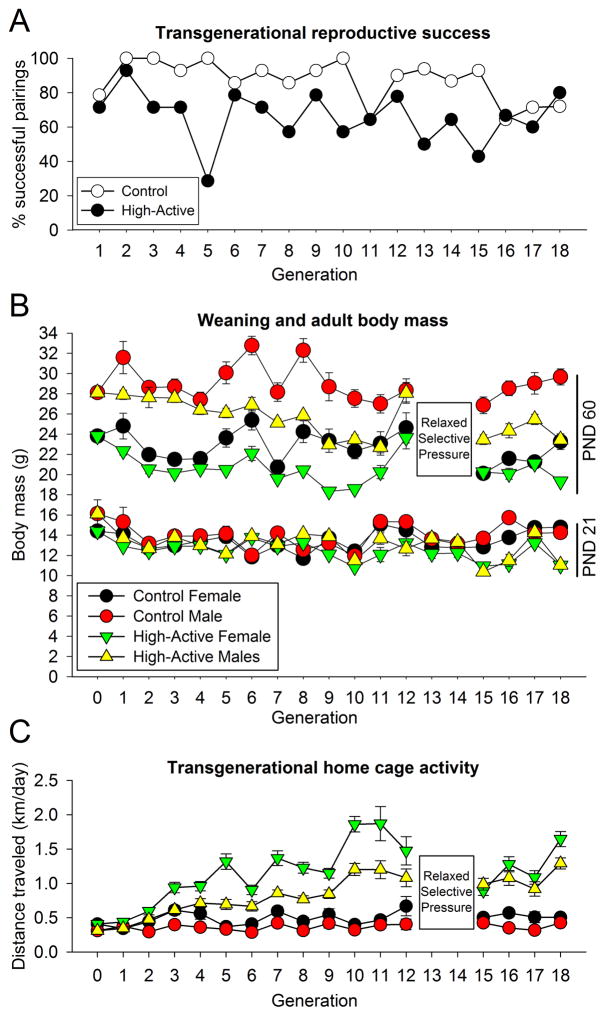
Figure 1. Transgenerational data.
A. Each data point reflects the percentage of paired mice each generation which successfully contributed offspring to propagate the lines. Typically 14 High-Active and 14 Control pairs were made during each breeding cycle. B. Average body mass in grams (±SEM) at PNDs 21 (weaning) and 60 (adulthood phenotyping) are represented for each generation. During Generations 13 and 14, mice were not phenotyped, therefore adulthood body mass was not recorded (as indicated by the boxed “relaxed selective pressure”). C. Data reflect the average locomotor activity in the home cage in km/day (±SEM) of adult High-Active and Control mice. Each data point reflects the phenotype of between 100–200 High-Active and Control mice per generation. Mice underwent distance tracking in the home cage for six consecutive days; the 24-hour activity levels on days 5 and 6 of a six-day test were averaged to assess phenotype.

