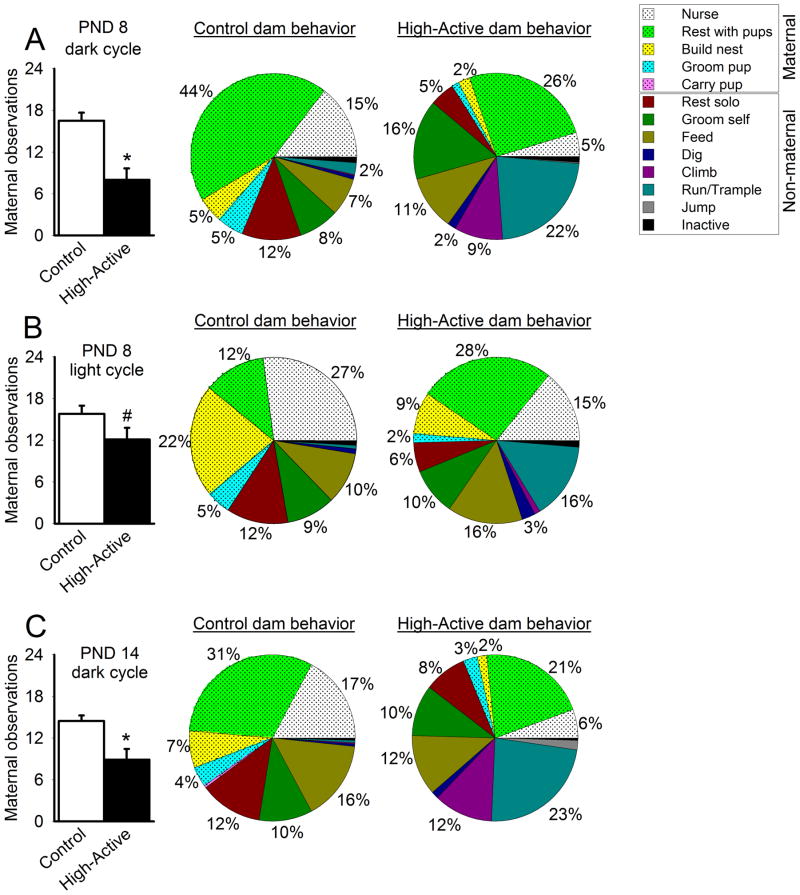
Figure 4. Maternal and non-maternal dam behaviors.
A total of 24 observations were made during each session, and dam activities were classified broadly into maternal versus non-maternal behaviors. Bar graph data represent the average number of maternally-related behaviors performed by Control versus High-Active dams (±SEM). An asterisk (*) denotes statistical significance (P≤0.05) between High-Active and Control groups. Pie charts summarize dam behavior both in detail and more broadly, as maternal behavior is shaded while non-maternal behavior is unshaded. Activities performed less than 1% of the time were not labeled with a percentage in pie charts. A. Maternal and non-maternal behavior recorded for dams 2–3 hours into the dark cycle (active phase) on pups’ PND 8. B. Maternal and non-maternal behavior recorded for dams 2–3 hours into the light cycle (inactive phase) on pups’ PND 8. C. Maternal and non-maternal behavior recorded for dams 2–3 hours into the dark cycle (active phase) on pups’ PND 14.

