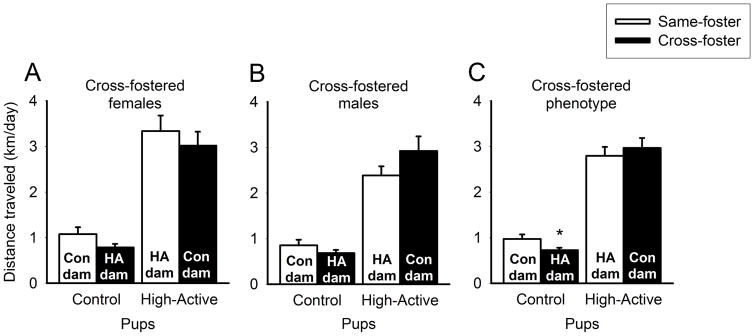
Figure 5. Environmental impact on phenotypic home cage activity.
Data represent the average home cage locomotor activity in km/day (±SEM) of Generation 19 cross-fostered offspring during adulthood. An asterisk (*) denotes statistical significance (P≤0.05) between Control pups raised by High-Active versus Control dams. A. Phenotype of female mice. B. Phenotype of male mice. C. Phenotype of all mice collapsed across sex.

