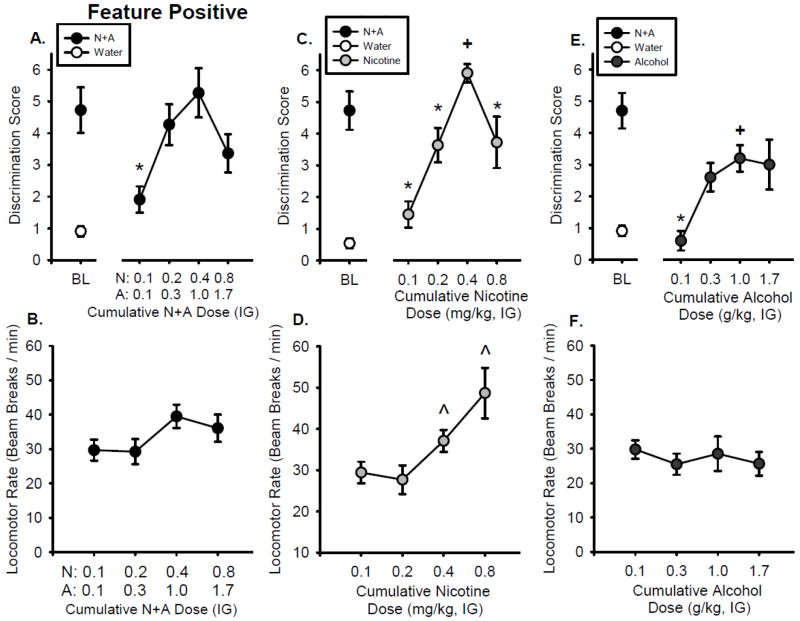
Figure 2.
Substitution curves for the Feature Positive group. Mean(±S.E.M.) discrimination score (head entries during the 15-s light CS minus head entries during 15 seconds before light onset, A) and locomotor rate (beam breaks per minute, B) for N+A substitution test. Mean(±S.E.M.) discrimination score (C) and locomotor rate (D) for nicotine only substitution test. Mean(±S.E.M.) discrimination score (E) and locomotor rate (F) for the alcohol only substitution test. *-denotes significant difference from training dose in the curve (p < 0.05). +-denotes significant difference from N+A baseline (p < 0.05). ˆ- denotes significant difference from lowest dose for locomotor rate (p < 0.05)

