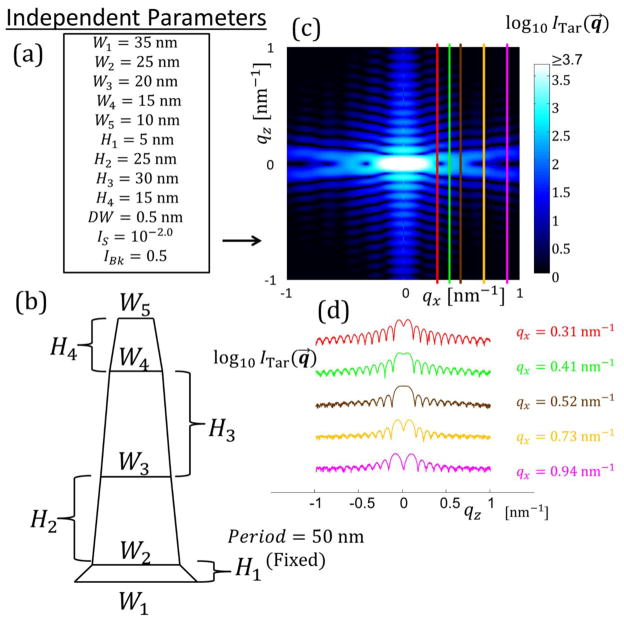
Fig. 11.
Figure analogous to Figure 3 in the main text for target structure with SC M = 4. Period is fixed as 50 nm. (a) Independent parameters defined for the SC M = 4 structure. (b) Schematic diagram of the shape profile for the SC M = 4 structure. (c) The simulated target structure intensity profile in qz versus qx for a range of [−1:1] nm−1. Intensity is plotted on a log scale with scale shown. Colored lines are constant qx cuts used for parameter optimization with the algorithms corresponding to the intensities shown in (d). (d) Log of target structure intensity slices used for fitting. Scale is arbitrary so the curves all fit on the same plot.

