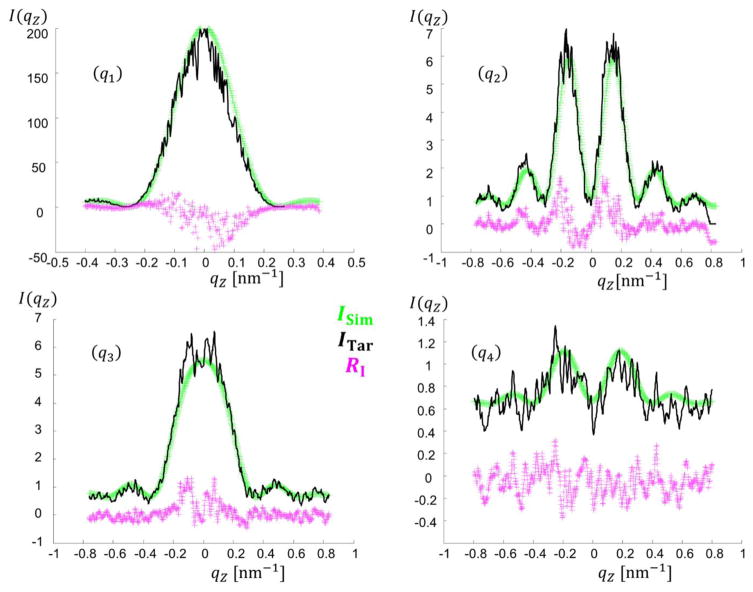
Fig. 14.
Comparison of plots of the intensity fits found by the CMAES algorithm with Ξ function for the experimental target structure data. The figure shows the experimental data ITar plotted in black, a fit curve ISim plotted in green, and the residuals RI = ITar − ISim between the fit and experimental data plotted in magenta. (q1) Slice 1 qx = 0.223 nm−1. (q2) Slice 2 qx = 0.451 nm−1. (q3) Slice 3 qx =0.677 nm−1. (q4) Slice 4 qx = 0.905 nm−1.

