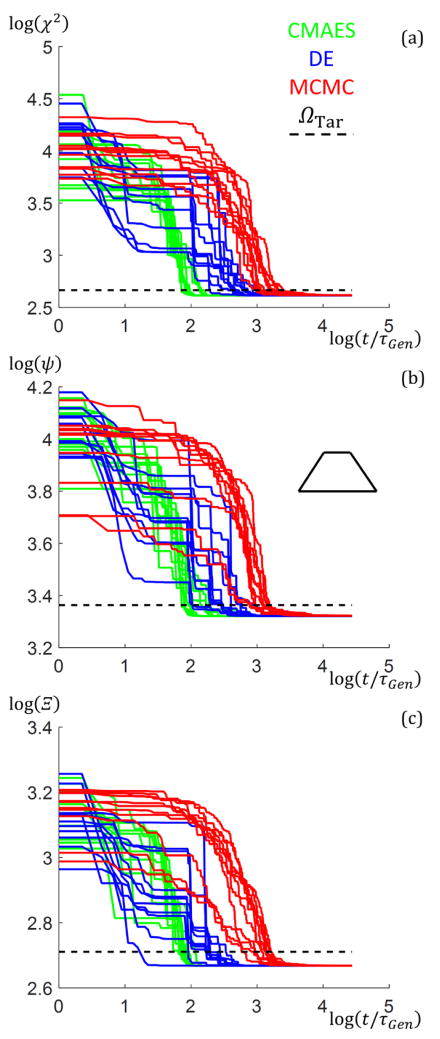
Fig. 15.
Plots of the goodness of fit values for all three algorithms versus the normalized time t/τGen for the SC M = 1 structure. Plots are on log base 10 scale. Inset is a key for which algorithm the colored curves correspond and a schematic of the target structure. The plots have black dashed lines showing the ΩTar values. Plots have all NRuns for the three algorithms of the goodness of fit values versus t/τGen superimposed with different shades of the algorithm distinguishing colors for better clarity. Note there was one case for the DE in (c) that reached ΩTar faster than the CMAES, but the final converged value of Ξ was slightly higher. (a) Ω = χ2. (b) Ω = ψ. (c) Ω = Ξ.

