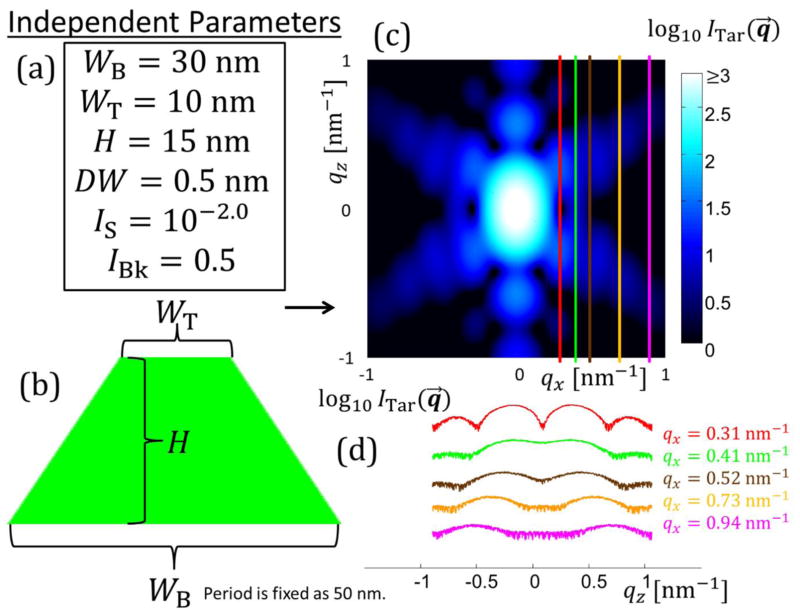
Fig. 3.
Schematic diagram of how known solution intensities were produced. (a) Set of independent parameters is defined for the real space structure with various geometric parameters and intensity scaling parameters. In this case three geometric parameters are required to define the bottom width WB, top width WT, and height H of a single symmetric trapezoid plus the three intensity scaling parameters DW, IS, and IBk. (b) Schematic diagram of the shape profile of the single trapezoid target structure. (c) Simulated intensity over the range of qx and qz values varying from ≈ −1 nm−1 to 1 nm−1. Intensity is plotted on a log scale for better contrast. Lighter blue regions are higher intensity and darker blue to black regions are low intensities. The five colored lines are the five intensity qz slices chosen for the inverse algorithm to use to solve for the structure. (d) Plots of the five intensity slices used in the inverse algorithm with the same coloring as from (c) with the respective qx values colored appropriately. Scaling of the intensity values is arbitrary to get all five curves onto one plot without overlapping.

