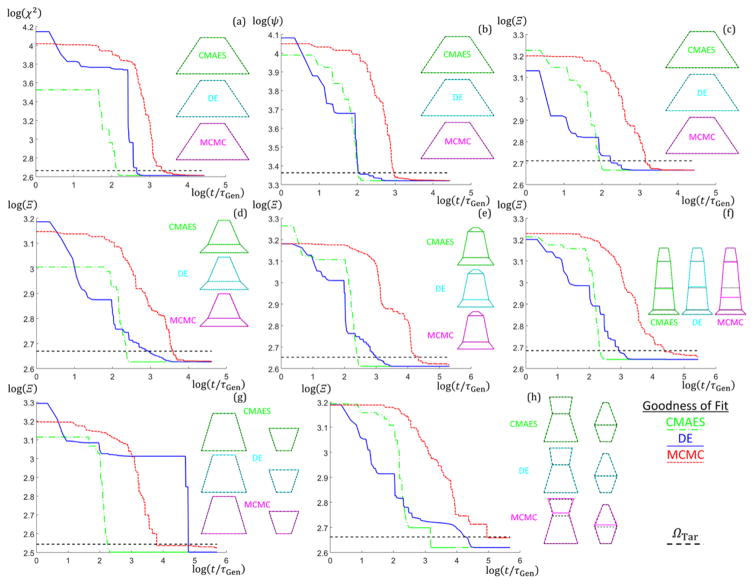
Fig. 5.
Plots of the best (lowest goodness of fit found from up to 10 runs) run goodness of fit values versus normalized time for different number of parameter structures using the three different algorithms (CMAES in green dash dotted lines, DE in blue solid lines, and MCMC in red dotted lines). Plots are log scale. ΩTar thresholds are shown as a black dashed line. Target shape profiles (black dashed lines) and solution shape profiles (CMAES in green, DE in cyan, and MCMC in magenta) are shown to the right of each corresponding Ω versus t/τGen plot. (a–c) NParam =6 SC M = 1. (a) Ω → χ2 (b) Ω → ψ (c) Ω → Ξ (d–h) Ω → Ξ (d) NParam = 8 SC M = 2. (e) NParam = 10 SC M = 3. (f) NParam = 12 SC M = 4. (g) NParam = 9 DC M = 1. (h) NParam = 13 DC M =2.

