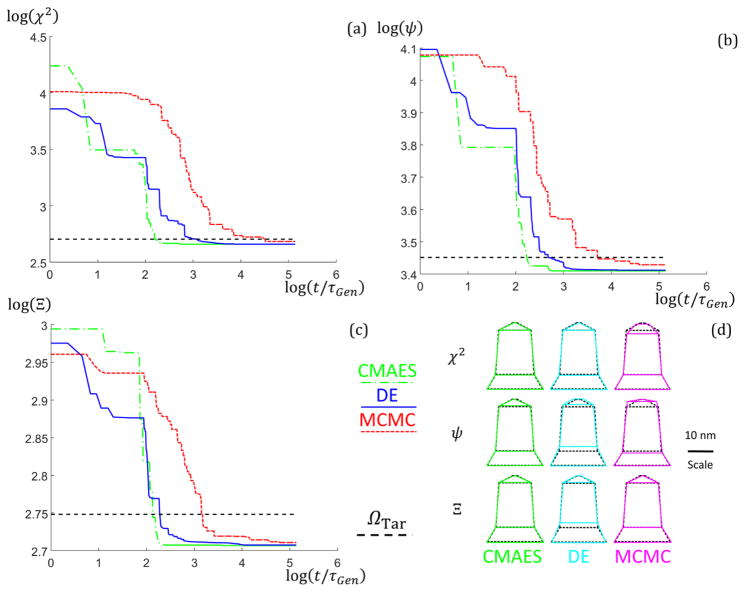
Fig. 6.
(a–c) Goodness of fit versus t/τGen results with M = 3 for the experimental data structure between the three algorithms (CMAES in green dash dotted lines, DE in blue solid lines, and MCMC in red dotted lines). Data is plotted on a log base 10 scale. Plots are best (lowest goodness of fit) data sets from 10 runs. (a) χ2 objective function was used. (b) ψ objective function was used. (c) Ξ objective function was used. (d) Geometric structure shape profiles for the best parameter set solutions found using the different objective functions (rows top to bottom are χ2, ψ, and Ξ) and algorithms (columns left to right are green for the CMAES, cyan for DE, and magenta for MCMC) for the M = 3 experimental data structure. Scale is inset on the right of the figure. The overlaid dotted black line structure is the solution found from the previous MCMC study for comparison.

