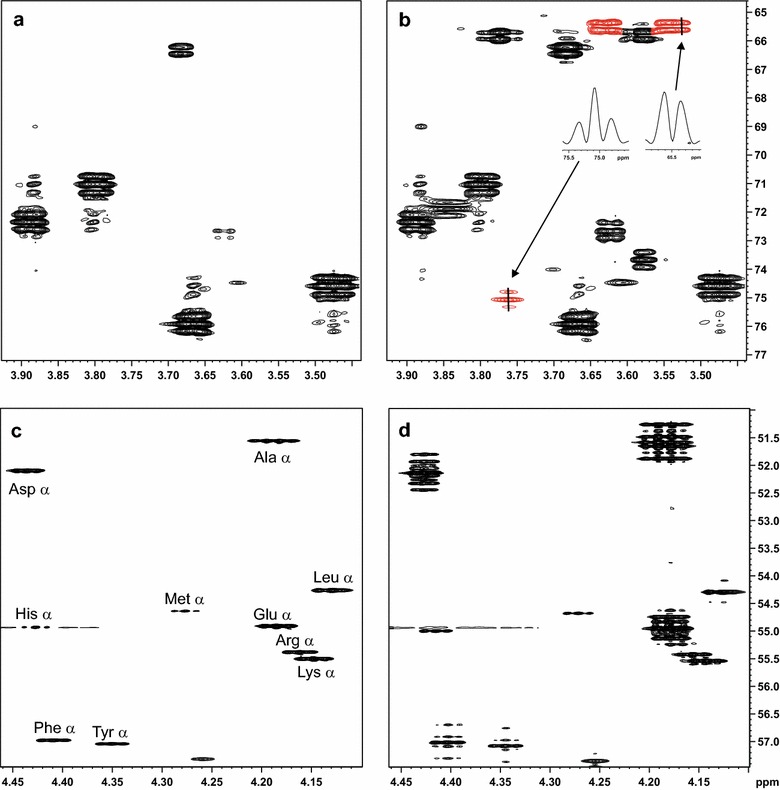
Fig. 3.

NMR analysis of the 13C tracing fermentations. Expansions of HSQC spectra of a the culture supernatant of the control strain H2806 (CEN.PK 113-1A) and b the strain H4535 containing the genes gaaA, lgd1, gaaC, gaaD and gat1. Signals of glycerol produced by H4535 are highlighted in red and the inserts show cross sections of these signals along F1, revealing the 13C-13C scalar coupling fine structure. These signals were not detected for the control strain. Part of the alpha carbon region of HSQC spectra of biomass hydrolysate of c the control strain and d the engineered strain, showing the 13C-13C scalar coupling fine structure in most signals
