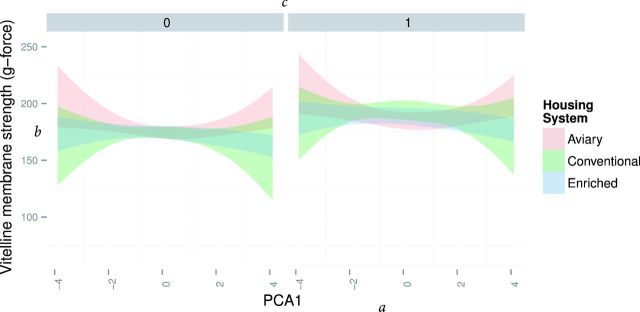
Figure 4.
Example output of the principle component approach (PCA). a represents one of the PCA variables (PCA 1) increasing from negative to positive value along the x-axis. b represents the y-axis and variable that is being modeled. c are the gray headers above each panel with increasing value (0 to 1) to represent the third dimension (PCA 2). The colored bands (red for aviary, green for conventional, and blue for enriched) illustrate the model responses representing the 95% credibility interval. Any overlapped areas indicate no significant difference while band separation indicates significant difference in the housing system.

