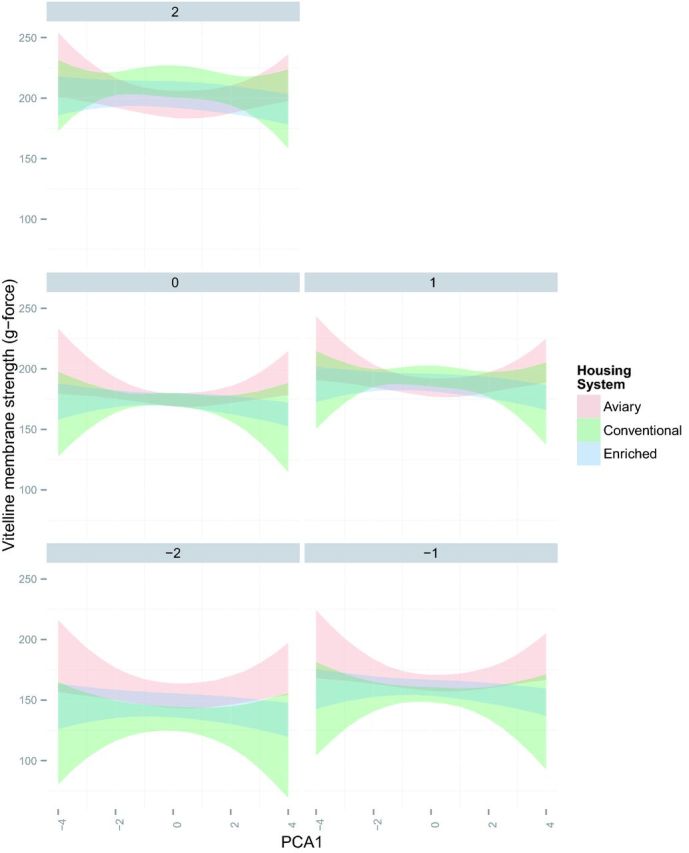
Figure 9.

Vitelline membrane strength. Monthly egg quality data analyzed with principle component approach (PCA) evaluating nutrient and energy intake values for laying hens during the production period. The figures present the 95% credibility intervals with red (aviary), green (conventional cage), and blue (enriched colony cage) with overlapping colors indicating no significant difference.
