. 2016 Aug 19;6:31065. doi: 10.1038/srep31065

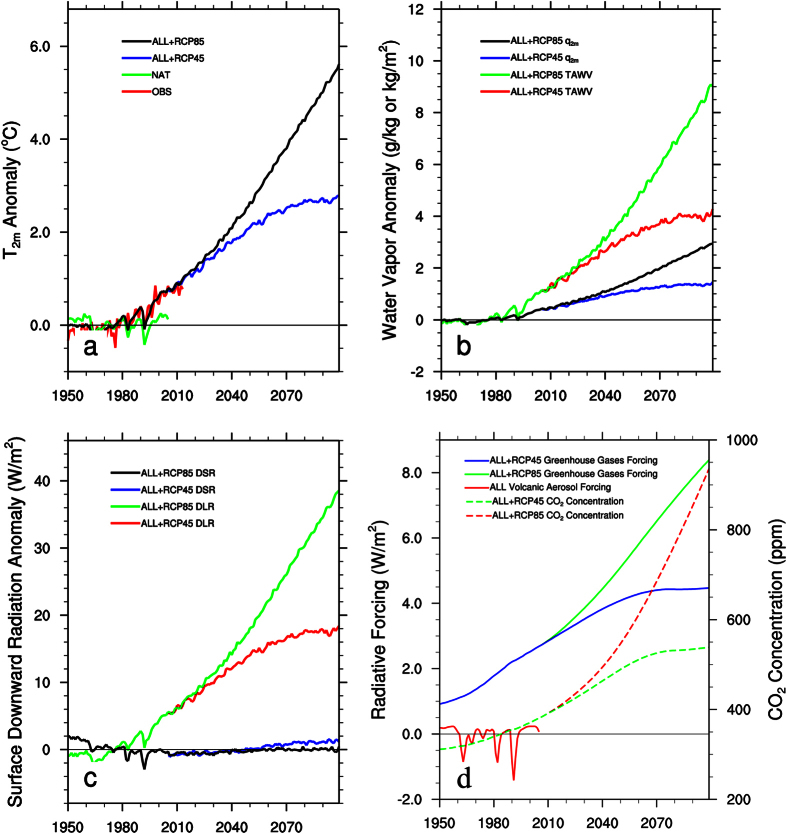
Figure 1. Interannual variations in regional mean March-November anomalies averaged over the entire study region, relative to the 1961–1990 reference period, of surface air temperature (T2m, °C), surface specific humidity (q2m, g/kg), total atmospheric water vapor (TAWV, kg/m2), downward longwave radiation (DLR, W/m2) and downward shortwave radiation (DSR, W/m2) at the surface from observations (OBS) for 1950–2013 and simulations (ALL, NAT, RCP45 and RCP85) for 1950–2099, together with the corresponding total global mean greenhouse gases and volcanic aerosol radiative forcing (W/m2) and atmospheric CO2 concentration (ppm) provided in Meinshausenet al.7.

Figure 1