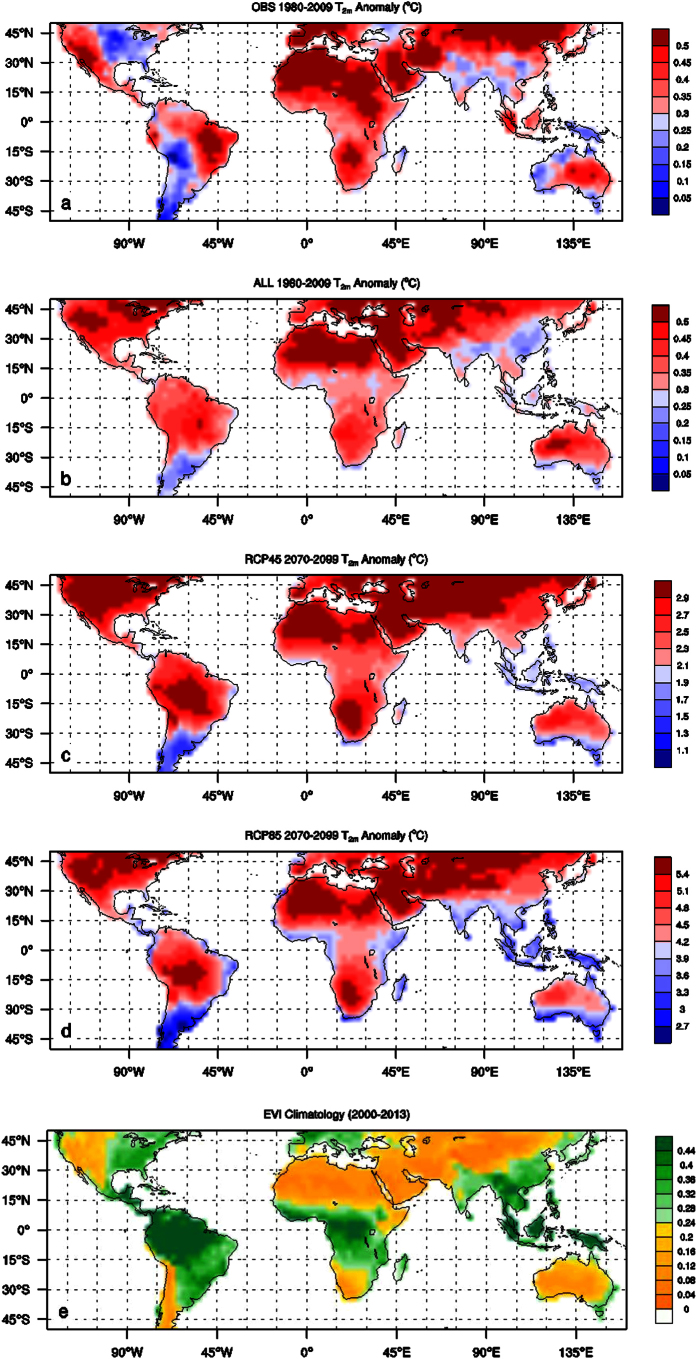
Figure 2.
Spatial patterns of 30-year mean surface air temperature anomalies (T2m, °C) relative to the 1961–1990 averages for two periods: (a) OBS 1980–2009, (b) ALL 1980–2009, (c) RCP45 2070–2099, and (d) RCP85 2070–2099, and (e) spatial patterns of climatological EVI (unitless) for the period 2000–2013, in 2.5° × 2.5° grid boxes over land. Map was created using CISL’s NCAR Command Language (NCL) (https://www.ncl.ucar.edu/) Version 6.0.0.

