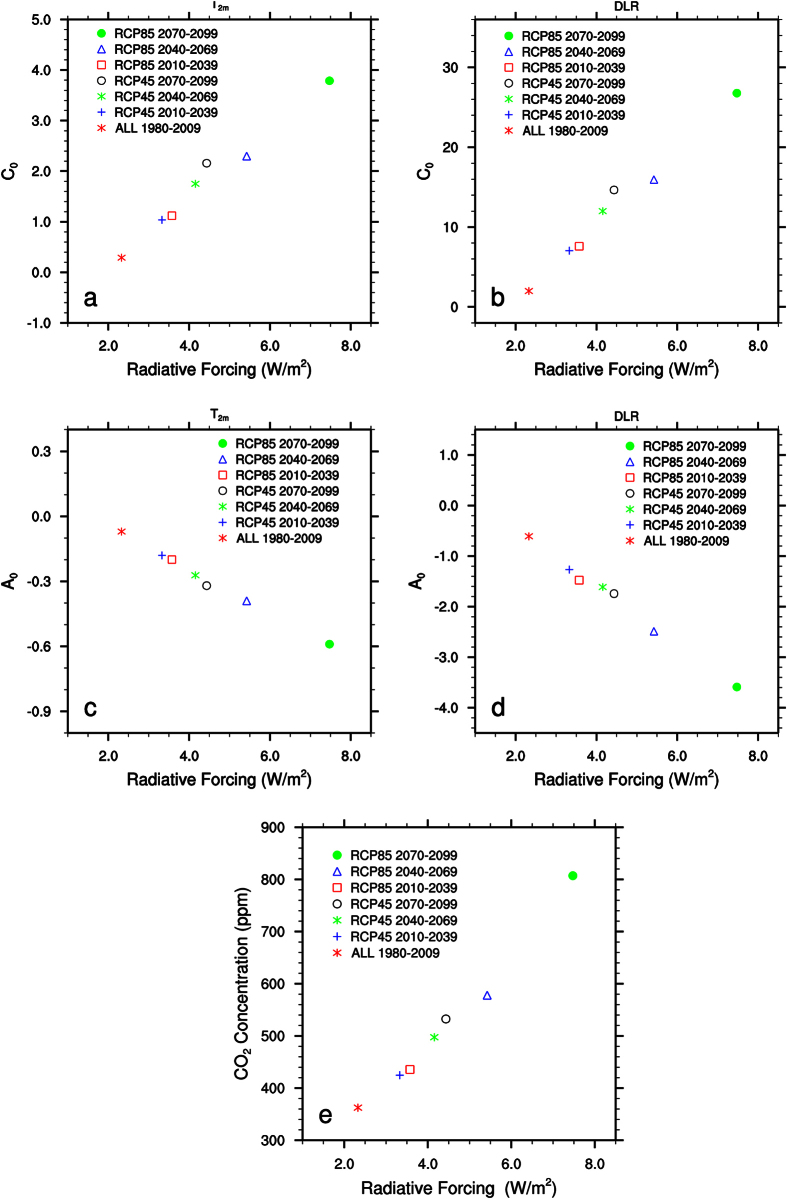
Figure 4.
Scatter plots of fitted coefficients (C0 and A0 for the logarithmic fit of T2m and DLR) and atmospheric CO2 concentration as a function of the global mean GHGs radiative forcing (W/m2, Fig. 1d) for different 30-year periods: (a) C0 for surface air temperature anomalies (T2m, °C), (b) C0 for surface downward longwave radiation (DLR, W/m2), (c) A0 for T2m, (d) A0 for DLR, and (e) atmospheric CO2 concentration (ppm). For each period, the arithmetic mean fitted coefficients are obtained from Tables 1, 2.

