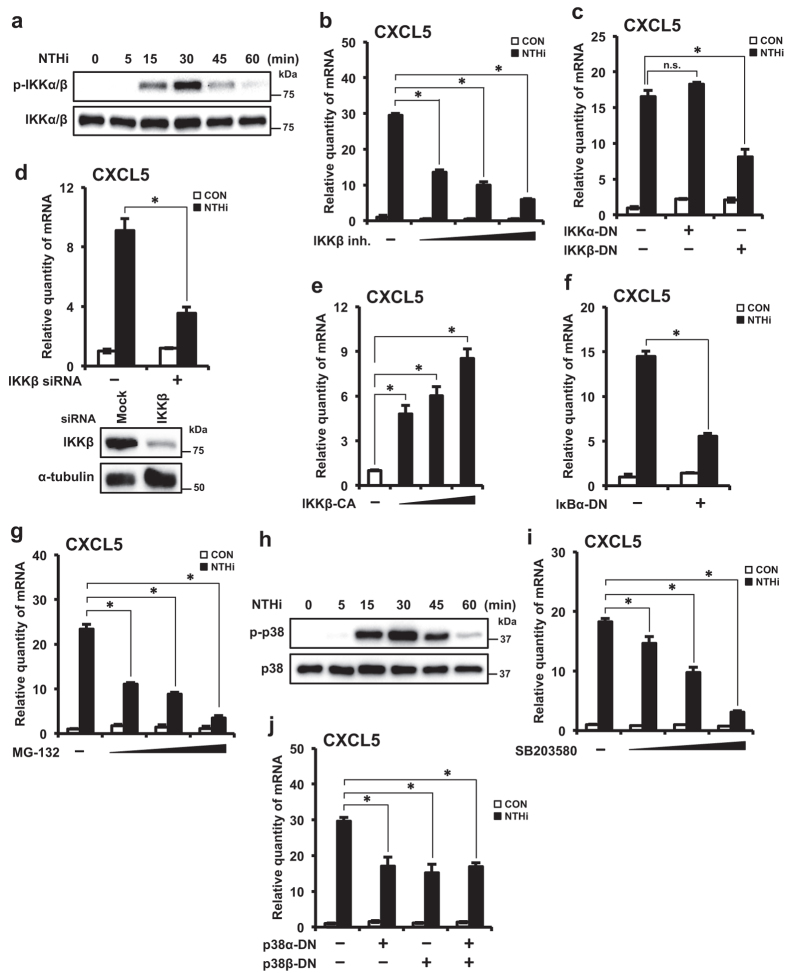
Figure 3. Activation of IKKβ-IκBα and p38 signaling pathways are required for NTHi-induced CXCL5 expression.
(a) HMEECs were stimulated with NTHi for various time intervals as indicated in the figure. Phospho-IKKα/β, total IKKα/β protein levels were visualized by western blot. (b) HMEECs were pre-treated with IKKβ inhibitor (0.25, 0.5 or 1.0 μM) for 1 h, followed by stimulation with NTHi for 5 h, and CXCL5 mRNA expression was measured. (c) HMEECs were transfected with Mock, IKKα-DN or IKKβ-DN plasmid. Cells were stimulated with NTHi for 5 h, and CXCL5 mRNA expression was measured. (d) HMEECs were transfected with control siRNA or IKKβ siRNA. Cells were stimulated with NTHi for 5 h, and CXCL5 mRNA expression was measured. Knockdown of IKKβ protein by siRNA was confirmed by western blot. (e) HMEECs were transfected with Mock, IKKβ–CA (0.25, 0.5 or 1 μg) plasmid. CXCL5 mRNA expression was measured. (f) HMEECs were transfected with Mock or IκBα (S32A/S36A) plasmid. Cells were stimulated with NTHi for 5 h, and CXCL5 mRNA expression was measured. (g) HMEECs were pre-treated with MG-132 (5, 10 or 20 μM) for 1 h, followed by stimulation with NTHi for 5 h, and CXCL5 mRNA expression was measured. (h) HMEECs were stimulated with NTHi for various time intervals as indicated in the figure. Phospho-p38, total p38 protein levels were visualized by western blot. (i) HMEECs were pre-treated with SB203580 (5, 10 or 20 μM) for 1 h, followed by stimulation with NTHi for 5 h, and CXCL5 mRNA expression was measured. (j) HMEECs were transfected with Mock, p38α–DN, p38β–DN or both (p38α–DN and p38β–DN) plasmids. Cells were stimulated with NTHi for 5 h, and CXCL5 mRNA expression was measured. Data are mean ± s.d. (n = 3). (b,c,e,g,i,j) *p < 0.05, ANOVA (Tukey’s post-hoc). (d,f) *p < 0.05, t-test. n.s., not significant. Displayed immunoblots are cropped images from full-length blots, presented in Supplementary Fig. S1. Data are representative of three or more independent experiments.

