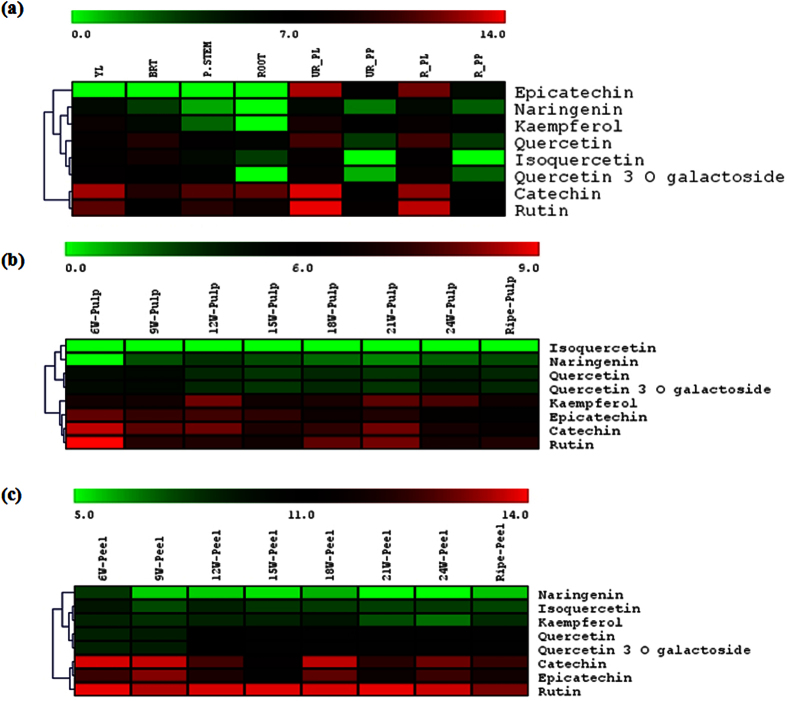
Figure 6. Metabolite analysis in different tissues of banana.
Phytochemical analysis of methanolic extracts of different tissues (a), fruit pulp (b) and peel (c) of banana. Metabolites were quantified by separating methanolic extracts using HPLC. Log2 transformed values were used for heat map construction. Green to red colour is showing lower to higher expression of genes. Individual values were given in supporting information Table S2.

