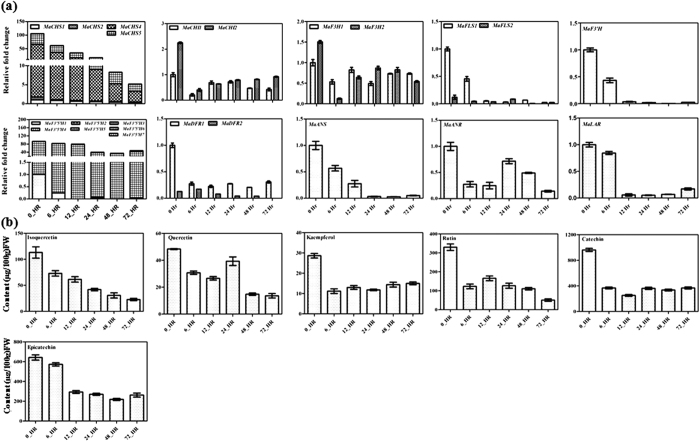
Figure 7. Expression of genes and flavonoid content following dark treatment.
(a) Expression of genes associated with flavonoid biosynthetic pathway was analyzed by Real-Time PCR using RNA from different time points of dark exposed leaves of banana plantlets. In each case, expression level is expressed as relative fold change as compared to the control leaves (zero hour). (b) Phytochemical analysis of methanolic extracts from different time points of dark exposed leaves of banana plantlets. Compounds were quantified by separating methanolic extracts using HPLC. The graph shows values ± SD of three samples from each of the independent plantlets.

