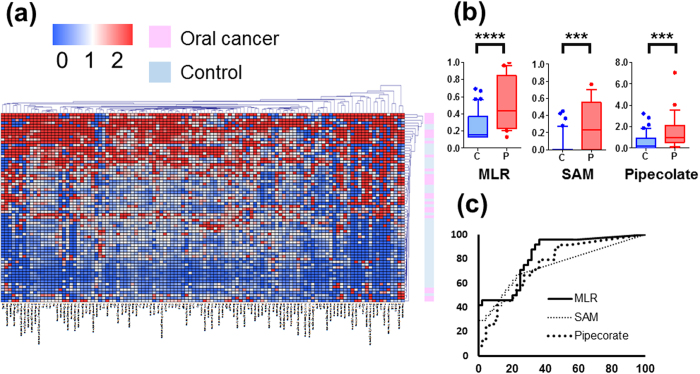
Figure 2. Metabolomic profiles in saliva.
(a) A heat map shows metabolomic profiles in saliva samples. Both metabolites and samples were clustered using elucidation distance. Light pink and blue indicate oral cancer and controls, respectively. Samples colored in the red–white–blue scheme indicate relatively higher, average, and lower concentrations, respectively. Metabolites detected in ≥60% of either oral cancer or controls were used. (b) Probability of oral cancer using an MLR model and concentrations of S-adenosylmethionine (SAM) and pipecolate. ****P < 0.0001, ***P < 0.001. (c) ROC curves of data in (b) to differentiate oral cancer patients from healthy controls.

