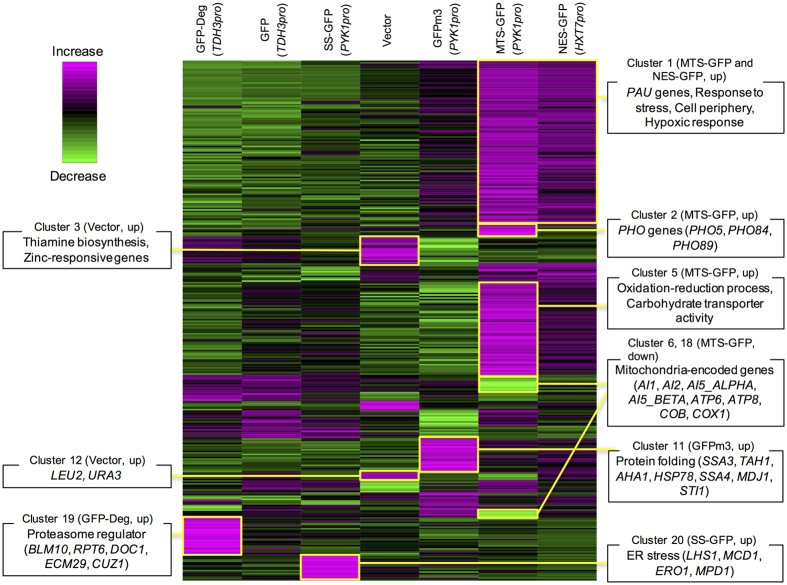
Figure 2. Transcriptional response upon high-level expression of modified GFP.
The mRNAs expressed in the cells expressing modified GFPs were analyzed by DNA microarray analysis. Expressed modified GFPs and the promoters are shown at the top. Genes whose expression levels changed by greater than two-fold over the mean of all experiments were isolated and divided into 20 clusters according to the similarities in their expression profiles. Clusters containing genes with specific functional categories are shown. Expression patterns of characteristic clusters are shown in Supplementary Figure S4, and genes in each cluster are listed in Supplementary Table S2.

