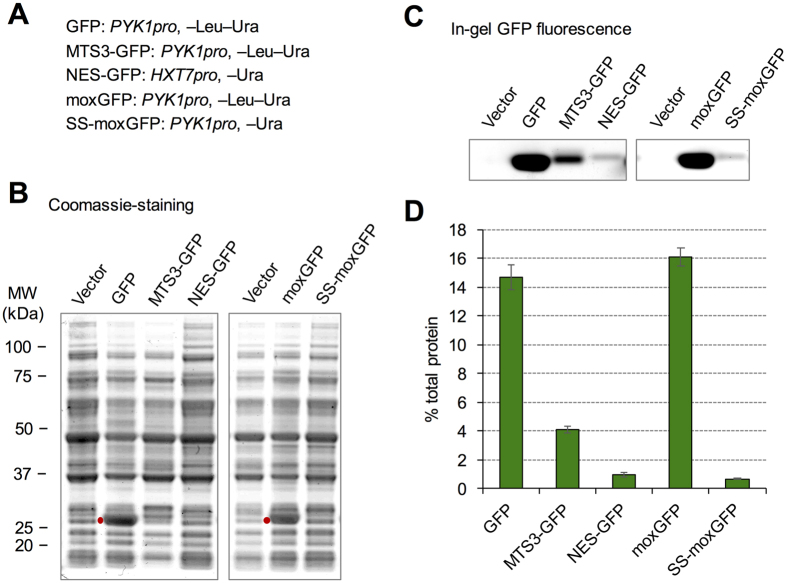
Figure 6. Estimation of protein expression limits of GFPs with localization signals.
(A) Promoter and growth conditions used to express each modified GFP. (B) Coomassie staining of SDS-PAGE-separated total cellular proteins. Red points indicate GFP bands. (C). In-gel fluorescence of modified GFPs. Uncropped original blot images can be found in Supplementary Figure S12. (D) Expression levels of modified GFPs as a proportion of total protein.

