
Figure 2. Comparative analysis of the set of genes regulated by genistein in S. fredii HH103 (red circle), and its nodD1 (blue circle) and ttsI (yellow circle) mutant derivatives.
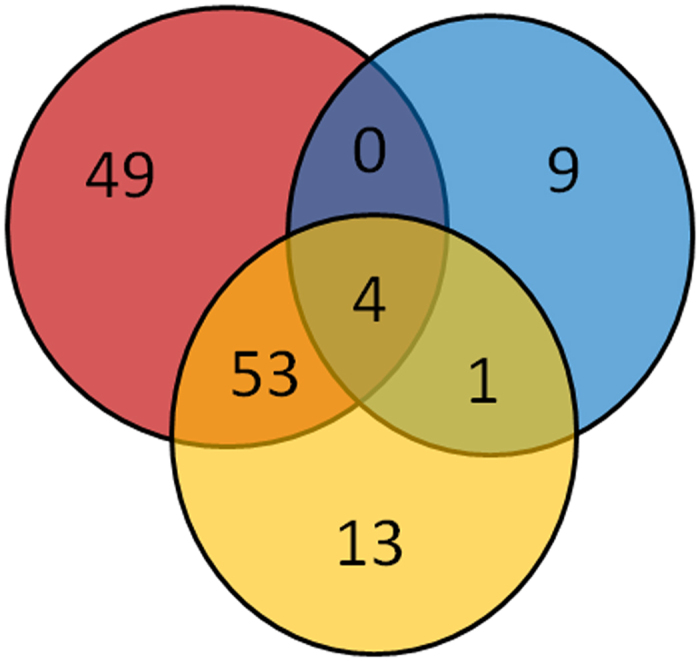
The differences among these strains are visualized by a Venn diagram. The number of genes that are either individual for a certain strain or that are affected in two or three strains are indicated.