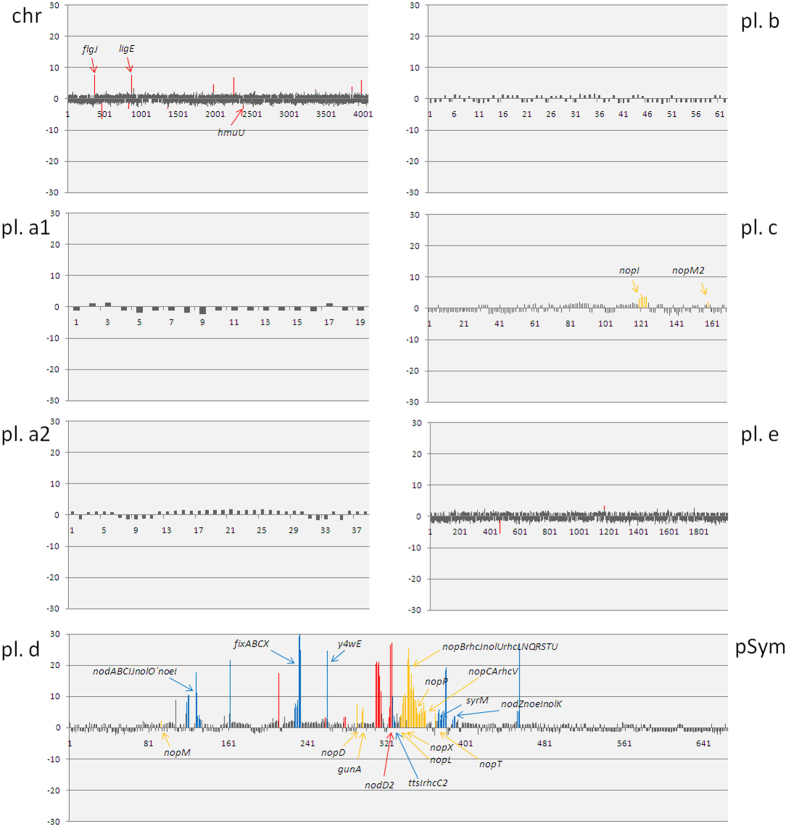
Figure 4. Linear representation of the complete RNA-seq-based transcriptomic data set of bacterial cultures induced with genistein for all replicons of S. fredii HH103.
Bars represent fold-change expression values. Each bar corresponds to one gene, being ordered according to their relative position in the replicon. Chr: Chromosome, pl. a1: pSfHH103a1, pl. a2: pSfHH103a2, pl. b: pSfHH103b, pl. c: pSfHH103c, pl. d (pSym): pSfHH103d and pl. e: pSfHH103e. Blue bars: ORFs regulated by genistein preceded by nod boxes and regulated by NodD1. Yellow bars: ORFs regulated by genistein preceded by tts boxes and regulated by TtsI. Red bars: ORFs regulated by genistein but not dependent on nod or tts boxes. Gene names shown correspond to those genes that have been annotated.

