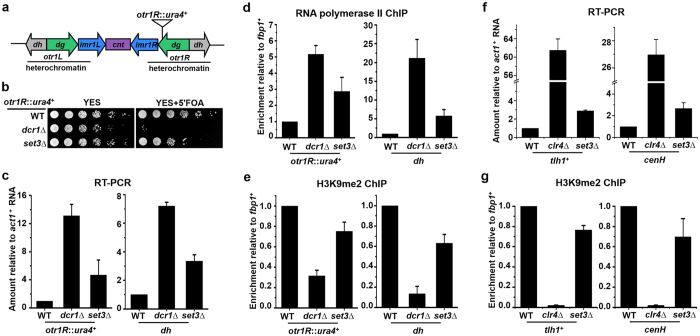
Figure 1. Set3 contributes to the integrity of heterochromatin.
(a) A schematic representation of centromere 1 and the position of a inserted marker gene (otr1R::ura4). The pericentromeric heterochromatin region is indicated. (b) A fivefold serial dilution assay to examine the silencing of otr1R::ura4. Wild-type (WT) cells with silenced ura4+ grow normally on medium containing 5′-FOA, while loss of silencing kills cells on 5′-FOA. (c) RT-PCR analysis of otr1R::ura4+ and pericentromeric repeat (dh) RNA levels relative to a control act1+. The relative level in WT cells was arbitrarily designated as 1. Each column shown in (c) and below represents the mean ± s.d. from three biological repeats. (d,e) ChIP analysis of RNA Polymerase II (d) and H3K9me2 (e) at otr1R::ura4 and dh relative to fbp1+. Relative enrichment in WT cells was arbitrarily designated as 1. (f) RT-PCR analysis of tlh1+ and cenH RNA levels relative to a control act1+. (g) ChIP analysis of H3K9me2 at tlh1+ and cenH relative to fbp1+.

