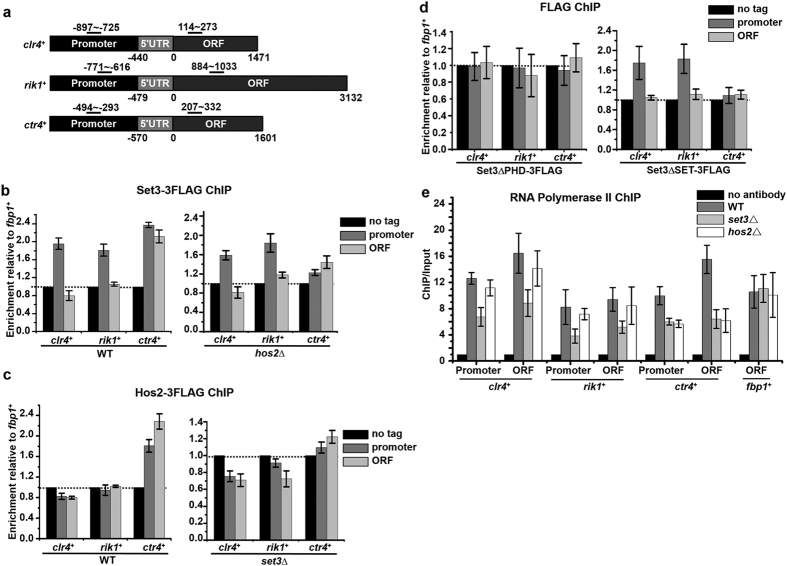
Figure 4. Set3 localizes to the promoters of clr4+ and rik1+ through its PHD finger.
(a) Schematic representations of clr4+, rik1+ and ctr4+ loci. Black bars indicate the fragments amplified in ChIP assay. (b–d) ChIP analysis of enrichments of Set3-3FLAG (b), Hos2-3FLAG (c), Set3ΔPHD-3FLAG (d) and Set3ΔSET-3FLAG (d) at promoter and ORF region of clr4+, rik1+, or ctr4+ in the indicated strains. Relative enrichment to fbp1+ in the cells with no tag was arbitrarily designated as 1. Each column shown in (b) and below represents the mean ± s.d. from three biological repeats. (e) ChIP analysis of enrichments of RNA Pol II at promoter and ORF region of clr4+, rik1+, ctr4+ or fbp1+in the indicated strains. Relative enrichment in the no antibody control was arbitrarily designated as 1.

