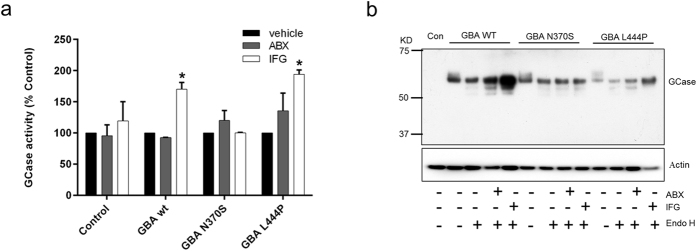
Figure 7. GCase activity and protein levels in wt, N370S and L444P flies following chaperone treatment.
(a) GCase activity measured in flies treated with vehicle (veh, black), ambroxol (ABX, grey) or isofagomine (IFG, white) for 10 days. Data are expressed as % GCase activity compared to respective veh treated fly line. (b) Representative immunoblot for human GCase in respective fly lines in the absence or presence of ABX and IFG for 10 days. Lysates were treated with or without endoglycosidase H (endoH) prior to immunoblot. Data represent mean ± SEM (*P < 0.05 vs. respective vehicle treatment).

