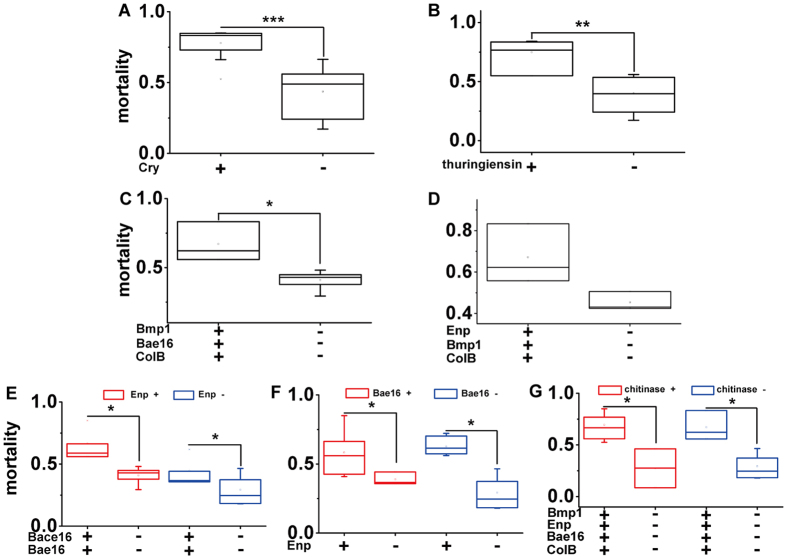
Figure 3. Relationships between the presence of putative virulence factors and nematicidal capacities.
Correlations between virulence factors and capacities are based on the combination of putative virulence factors and nematicidal activity (Table S8). Bars represent the standard error given the sampling size of strains in each mechanism. Comparisons were carried out between factor-producing strains and non-producing strains. (A) Pore-forming mechanism of Cry, (B) Inhibition-like mechanism of thuringiensin, (C) Degradation mechanism of putative Bmp1, Bae16 and ColB, (D) Degradation mechanisms of putative Enp, Bmp1 and ColB, (E) Trojan horse mechanism (right) and combined degradation mechanism of Trojan horse mechanism and putative Enp (left), (F) Combined degradation mechanism of putative Enp and Bae16 (left) and degradation mechanism of putative Enp (right), (G) Combined degradation mechanism of putative Enp, Bmp1, Bae16, ColB and chitinases (left) and degradation mechanism of putative Enp, Bmp1, Bae16 and ColB (right). Data are shown as the means ± the standard deviation of at least three strains. Bars indicate the means ± standard deviation of at least three strains. The significance of differences among samples was evaluated using a two sample t-test at p < 0.001 (***), p < 0.01 (**) and p < 0.05 (*).

