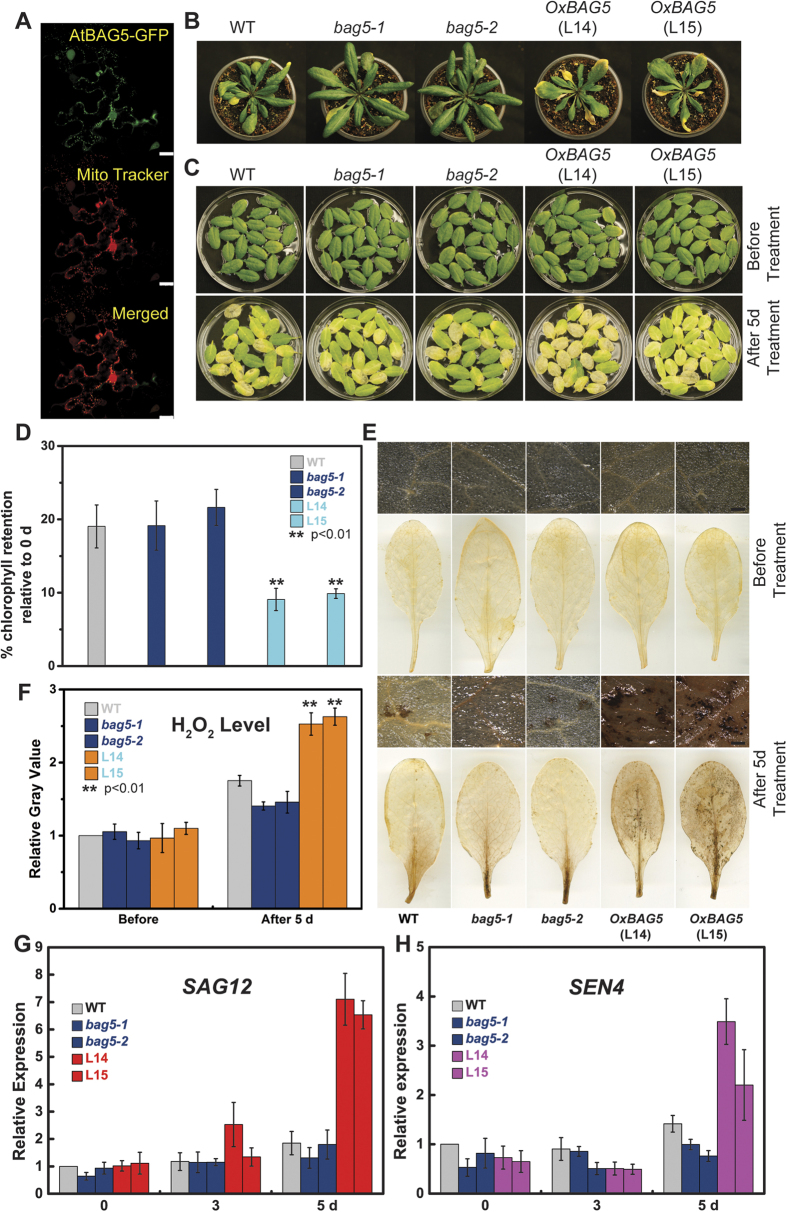
Figure 4. Effect of AtBAG5 on leaf senescence.
(A) Co-localization experiment using confocal microscopy. AtBAG5-EGFP-TerAtBAG5 fluorescence and CD3-991 fluorescence are shown in green and red, respectively. Yellow indicates colocalization of the BAG5-EGFP and marker signals. Scale bar = 25 μm. (B) Senescence phenotype of wild type, bag5-1/bag5-2 mutants and OxBAG5 transgenic plants. Rosettes from 38-day-old plants are shown. (C) Leave phenotype of wild type, bag5-1/bag5-2 mutants and OxBAG5 plants before and after 5-day dark treatment. The experiment was performed with ≥3 replicates and ≥10 plants in each replicate. (D) The percentage of chlorophyll retention was calculated relative to day 0. The experiment was performed with ≥3 replicates. (E) DAB staining of detached leaves without treatment and treated with 5-day dark treatment. The results were reproduced in three independent experiments using three plants in each experiment. Scale bar = 500 μm. (F) Quantitative gray values of ROS production were measured from DAB stained leaves. (G,H) The expression levels of SAG12 and SEN4 in the wild type, bag5-1/bag5-2 mutants, and OxBAG5 overexpression lines. Values are mean ± SE (n = 3 experiments). The relative expression was normalized using the internal control TIP41.

