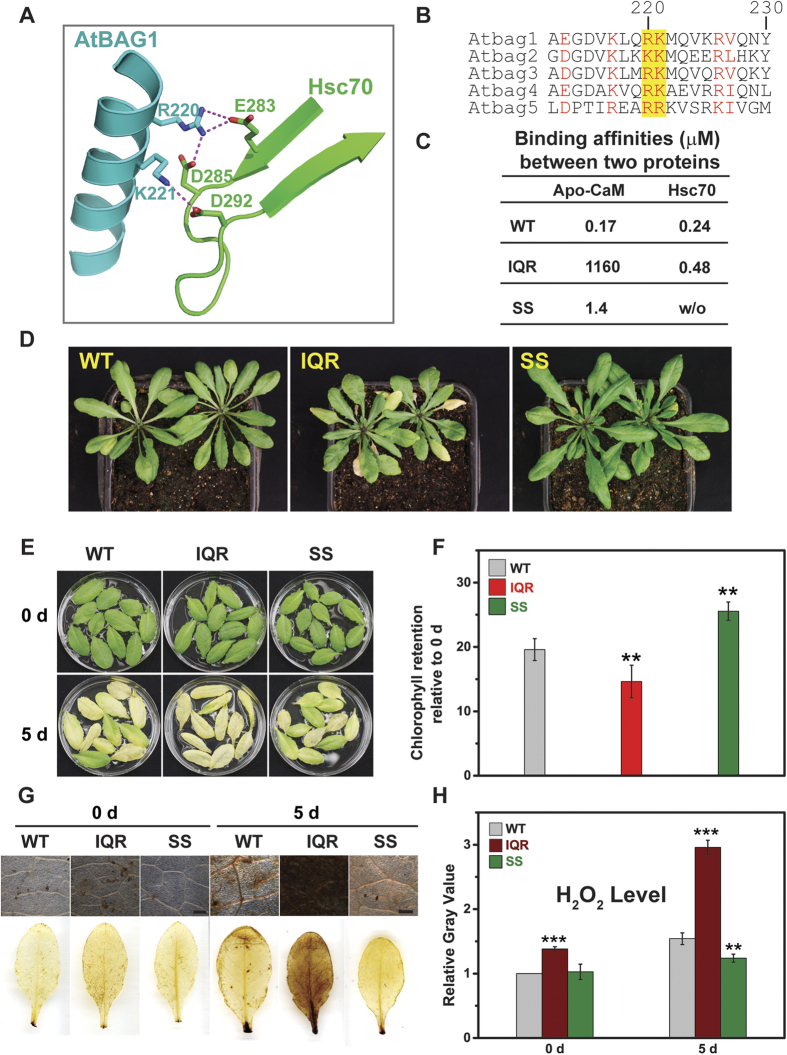
Figure 5. Characteristics of gain- and loss-of-function AtBAG5 mutant plants.
(A) The detailed interaction of AtBAG1 (cyan) with Hsc70 (green). (B) Sequence alignment of AtBAG1-AtBAG5. Conserved residues are colored red. Key residues responsible for the association of the BAG domain with Hsc70 are highlighted yellow. (C) Binding affinities of wild-type and mutant AtBAG5 with CaM and Hsc70. w/o indicates no detectable association with ITC. (D) Senescence phenotypes of wild type, IQR mutant and SS mutant. (E) Leaf phenotypes of wild-type, IQR mutant and SS mutant plants before and after 5-day dark treatment. (F) The percentage of chlorophyll retention was calculated relative to day 0. **Denotes p < 0.05. (G) DAB staining of detached leaves without treatment and after 5 -day dark treatment. Scale bar = 500 μm. (H) Quantitative gray values of ROS production were measured. **Denotes p < 0.05; ***denotes p < 0.01.

