
Figure 2.
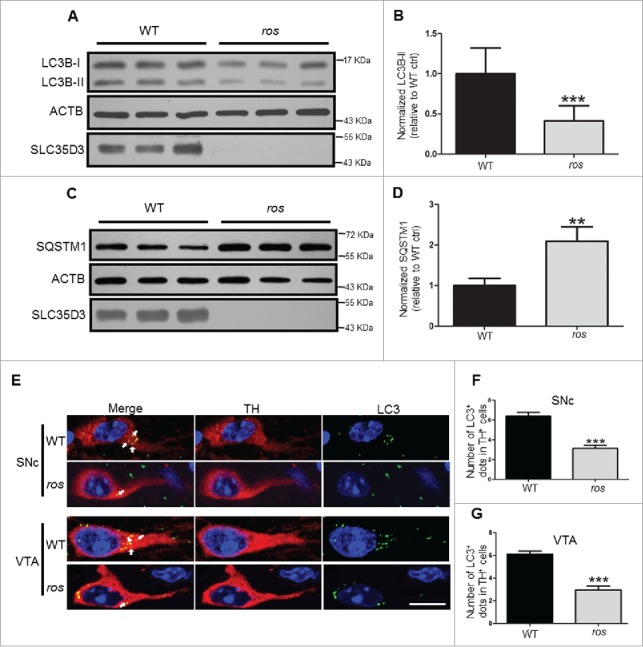
Reduced LC3B-II levels in ros midbrain. (A, B) Steady-state level of LC3B-II in the midbrain containing the SN and VTA was lower in ros mice compared with wild type (WT). ACTB/β-actin was used as a loading control. Bars represent mean ± SEM, WT: n = 12, ros: n=11; ***, P < 0.001. (C, D) Steady-state level of insoluble SQSTM1 in the SN and VTA was increased in ros mice compared with WT mice. ACTB was used as a loading control. Bars represent mean ± SEM, n = 3; **, P < 0.01. (E) Representative images of LC3 puncta (green) stained with anti-LC3 antibody in TH-labeled (red) neurons. Arrows show the LC3 -positive dots. Scale bar: 10 μm. (F) The number of autophagosomes in TH+ neurons from the SNc was reduced in ros mice. 225 neurons were counted from 5 WT mice, 238 neurons were counted from 5 ros mice. WT, 6.40 ± 0.39 dots/TH+ neuron; ros, 3.15 ± 0.29 dots/TH+ neuron; ***, P < 0.001. (G) The number of autophagosomes in TH+ neurons from the VTA was reduced in ros mice. 239 neurons were counted from 5 WT mice, 261 neurons were counted from 5 ros mice. WT, 6.10 ± 0.27 dots/TH+ neuron; ros, 2.95 ± 0.34 dots/TH+ neuron; ***, P < 0.001.