
Figure 7.
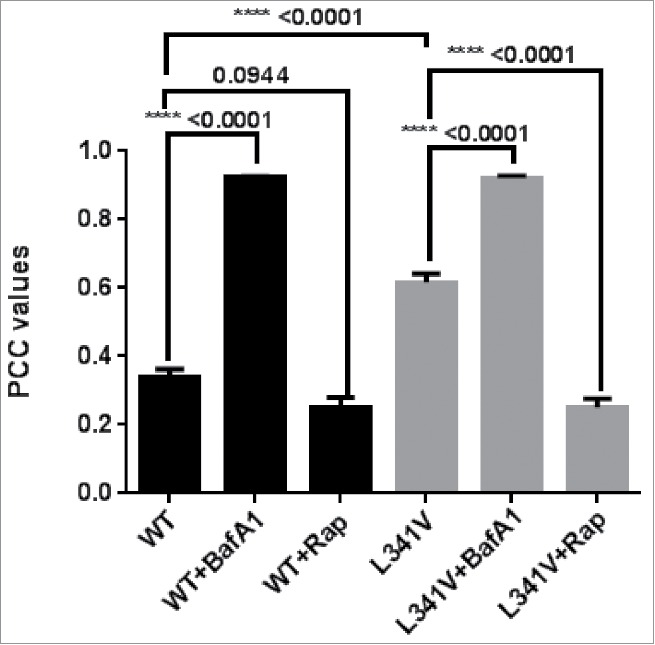
Quantification of colocalization of mCherry-EGFP-SQSTM1 transfected NSC-34 cells. Mean Pearson Correlation Coefficient (PCC) values of mCherry and EGFP overlap taken from a minimum of 50 cells per condition (NSC-34 cells transfected with mCherry-EGFP-SQSTM1 constructs) over a minimum of 3 independent experiments, with SEM indicated. Note the significant increase in PCC value in the wild-type-expressing cells treated with BafA1 and in the L341V mutant-expressing cells compared to wild type without BafA1 treatment (P values as indicated). When used cells were treated with 20 nM rapamycin 3 h before imaging (+Rap).