
Figure 3.
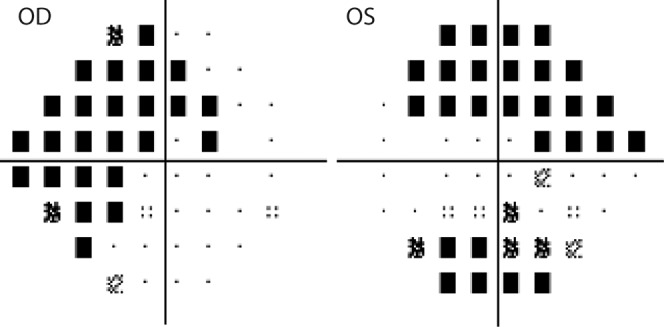
Perimetric pattern deviation maps from the same patient shown in Figure 2. Defects correspond with the locations of thinning observed in ganglion cell analysis.
Official websites use .gov
A
.gov website belongs to an official
government organization in the United States.
Secure .gov websites use HTTPS
A lock (
) or https:// means you've safely
connected to the .gov website. Share sensitive
information only on official, secure websites.
Perimetric pattern deviation maps from the same patient shown in Figure 2. Defects correspond with the locations of thinning observed in ganglion cell analysis.