
Fig. 4.
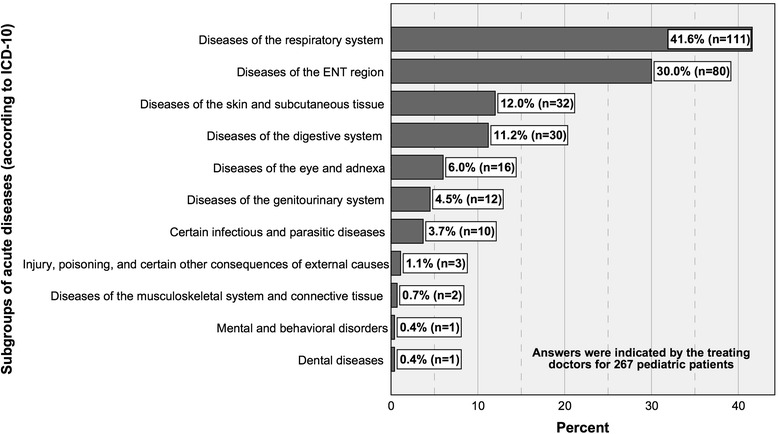
Subgroups of acute diseases (according to ICD-10) indicated by the treating doctors with percentages of sick children and numbers of cases. Subgroups that were not observed were excluded from the diagram (Table 1)
Official websites use .gov
A
.gov website belongs to an official
government organization in the United States.
Secure .gov websites use HTTPS
A lock (
) or https:// means you've safely
connected to the .gov website. Share sensitive
information only on official, secure websites.
Subgroups of acute diseases (according to ICD-10) indicated by the treating doctors with percentages of sick children and numbers of cases. Subgroups that were not observed were excluded from the diagram (Table 1)