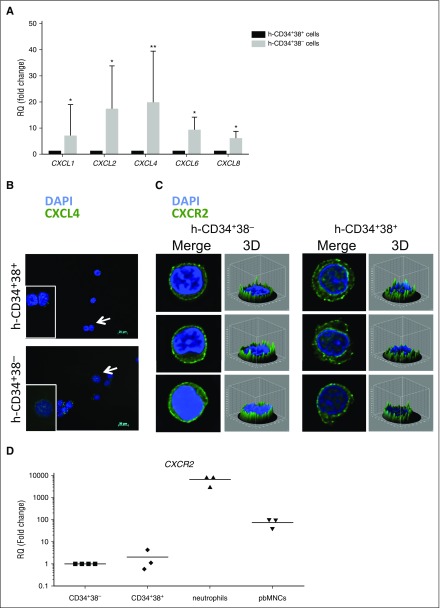
Figure 2.
CXCL4 and CXCR2 are expressed on CD34+38− and CD34+38+ cells. (A) RT-PCR in human CD34+38− and CD34+38+ cells shows gene expression differences for the chemokine ligands CXCL1, CXCL2, CXCL4, CXCL6, and CXCL8. Fold change was calculated relative to the reference gene (GAPDH) according to the ΔΔCT method. n = 5. *P < .05; **P < .01. All error bars indicate standard error of the mean (SEM). (B) Human CD34+38− (top) and CD34+38+ (bottom) cells show expression for CXCL4 (white arrows indicate cells in enlarged picture), and (C) CXCR2. Nuclei were stained using DAPI and images were acquired using a Zeiss microscope; 3-D figures generated with ImageJ software are shown for CXCR2 staining (n = 3). (D) Real-time quantitative PCR in human CD34+38−, CD34+38+, neutrophils, and PB mononuclear cells shows the gene expression profile for CXCR2 (n = 3). The fold change was calculated relative to the reference gene (GAPDH) according to the ΔΔCT method. 3-D, 3-dimensional; GAPDH, glyceraldehyde-3-phosphate dehydrogenase; h, human; RQ, relative quantitation.

