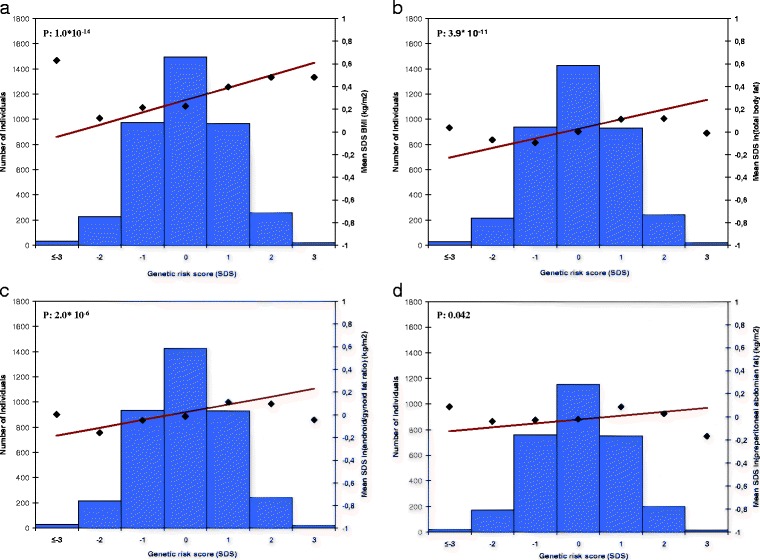
Fig. 2.

Association of adult body mass index genetic risk score with childhood adiposity measures (N = 3975). The x axis represents the categories of the risk score (overall sum of risk alleles, weighted by previous reported effect estimates, rescaled to SDS. The risk score ranged from −4 to 3 SDS and was rounded to the nearest integer for clarity of presentation). The right y axis shows the mean SDS and corresponds to the dots and a line representing the regression line of the mean SDS values for each category of the risk score. The y axis on the left corresponds to the histogram representing the number of individuals in each risk-score category. P-value is based on the continuous risk score, as presented in Table 3. Graph a-d represent; a BMI in kg/m2, b ln (fat mass percentage), c ln (android/gynoid fat ratio), and d ln (preperitoneal fat area)
